Earlier today our monitor stopped working and left us without heat when it was −35°F outside. I drove home and swapped the broken heater with our spare, but the heat was off for several hours and the temperature in the house dropped into the 50s until I got the replacement running. While I waited for the house to warm up, I took a look at the heat loss data for the building.
To do this, I experimented with the “Python scientific computing stack,”: the IPython shell (I used the notebook functionality to produce the majority of this blog post), Pandas for data wrangling, matplotlib for plotting, and NumPy in the background. Ordinarily I would have performed the entire analysis in R, but I’m much more comfortable in Python and the IPython notebook is pretty compelling. What is lacking, in my opinion, is the solid graphics provided by the ggplot2 package in R.
First, I pulled the data from the database for the period the heater was off (and probably a little extra on either side):
import psycopg2
from pandas.io import sql
con = psycopg2.connect(host = 'localhost', database = 'arduino_wx')
temps = sql.read_frame("""
    SELECT obs_dt, downstairs,
        (lead(downstairs) over (order by obs_dt) - downstairs) /
            interval_to_seconds(lead(obs_dt) over (order by obs_dt) - obs_dt)
            * 3600 as downstairs_rate,
        upstairs,
        (lead(upstairs) over (order by obs_dt) - upstairs) /
            interval_to_seconds(lead(obs_dt) over (order by obs_dt) - obs_dt)
            * 3600 as upstairs_rate,
        outside
    FROM arduino
    WHERE obs_dt between '2013-03-27 07:00:00' and '2013-03-27 12:00:00'
    ORDER BY obs_dt;""", con, index_col = 'obs_dt')
SQL window functions calculate the rate the temperature is changing from one observation to the next, and convert the units to the change in temperature per hour (Δ°F/hour).
Adding the index_col attribute in the sql.read_frame() function is very important so that the Pandas data frame doesn’t have an arbitrary numerical index. When plotting, the index column is typically used for the x-axis / independent variable.
Next, calculate the difference between the indoor and outdoor temperatures, which is important in any heat loss calculations (the greater this difference, the greater the loss):
temps['downstairs_diff'] = temps['downstairs'] - temps['outside']
temps['upstairs_diff'] = temps['upstairs'] - temps['outside']
I took a quick look at the data and it looks like the downstairs temperatures are smoother so I subset the data so it only contains the downstairs (and outside) temperature records.
temps_up = temps[['outside', 'downstairs', 'downstairs_diff', 'downstairs_rate']]
print(u"Minimum temperature loss (°f/hour) = {0}".format(
    temps_up['downstairs_rate'].min()))
temps_up.head(10)

Minimum temperature loss (deg F/hour) = -3.7823079517
| obs_dt | outside | downstairs | diff | rate |
|---|---|---|---|---|
| 2013-03-27 07:02:32 | -33.09 | 65.60 | 98.70 | 0.897 |
| 2013-03-27 07:07:32 | -33.19 | 65.68 | 98.87 | 0.661 |
| 2013-03-27 07:12:32 | -33.26 | 65.73 | 98.99 | 0.239 |
| 2013-03-27 07:17:32 | -33.52 | 65.75 | 99.28 | -2.340 |
| 2013-03-27 07:22:32 | -33.60 | 65.56 | 99.16 | -3.782 |
| 2013-03-27 07:27:32 | -33.61 | 65.24 | 98.85 | -3.545 |
| 2013-03-27 07:32:31 | -33.54 | 64.95 | 98.49 | -2.930 |
| 2013-03-27 07:37:32 | -33.58 | 64.70 | 98.28 | -2.761 |
| 2013-03-27 07:42:32 | -33.48 | 64.47 | 97.95 | -3.603 |
| 2013-03-27 07:47:32 | -33.28 | 64.17 | 97.46 | -3.780 |
You can see from the first bit of data that when the heater first went off, the differential between inside and outside was almost 100 degrees, and the temperature was dropping at a rate of 3.8 degrees per hour. Starting at 65°F, we’d be below freezing in just under nine hours at this rate, but as the differential drops, the rate that the inside temperature drops will slow down. I'd guess the house would stay above freezing for more than twelve hours even with outside temperatures as cold as we had this morning.
Here’s a plot of the data. The plot looks pretty reasonable with very little code:
import matplotlib.pyplot as plt
plt.figure()
temps_up.plot(subplots = True, figsize = (8.5, 11),
    title = u"Heat loss from our house at −35°F",
    style = ['bo-', 'ro-', 'ro-', 'ro-', 'go-', 'go-', 'go-'])
plt.legend()
# plt.subplots_adjust(hspace = 0.15)
plt.savefig('downstairs_loss.pdf')
plt.savefig('downstairs_loss.svg')
You’ll notice that even before I came home and replaced the heater, the temperature in the house had started to rise. This is certainly due to solar heating as it was a clear day with more than twelve hours of sunlight.
The plot shows what looks like a relationship between the rate of change inside and the temperature differential between inside and outside, so we’ll test this hypothesis using linear regression.
First, get the data where the temperature in the house was dropping.
cooling = temps_up[temps_up['downstairs_rate'] < 0]
Now run the regression between rate of change and outside temperature:
import pandas as pd
results = pd.ols(y = cooling['downstairs_rate'], x = cooling.ix[:, 'outside'])
results
-------------------------Summary of Regression Analysis-------------------------

Formula: Y ~ <x> + <intercept>

Number of Observations:         38
Number of Degrees of Freedom:   2

R-squared:         0.9214
Adj R-squared:     0.9192

Rmse:              0.2807

F-stat (1, 36):   421.7806, p-value:     0.0000

Degrees of Freedom: model 1, resid 36

-----------------------Summary of Estimated Coefficients------------------------
      Variable       Coef    Std Err     t-stat    p-value    CI 2.5%   CI 97.5%
--------------------------------------------------------------------------------
             x     0.1397     0.0068      20.54     0.0000     0.1263     0.1530
     intercept     1.3330     0.1902       7.01     0.0000     0.9603     1.7057
---------------------------------End of Summary---------------------------------
You can see there’s a very strong positive relationship between the outside temperature and the rate that the inside temperature changes. As it warms outside, the drop in inside temperature slows.
The real relationship is more likely to be related to the differential between inside and outside. In this case, the relationship isn’t quite as strong. I suspect that the heat from the sun is confounding the analysis.
results = pd.ols(y = cooling['downstairs_rate'], x = cooling.ix[:, 'downstairs_diff'])
results
-------------------------Summary of Regression Analysis-------------------------

Formula: Y ~ <x> + <intercept>

Number of Observations:         38
Number of Degrees of Freedom:   2

R-squared:         0.8964
Adj R-squared:     0.8935

Rmse:              0.3222

F-stat (1, 36):   311.5470, p-value:     0.0000

Degrees of Freedom: model 1, resid 36

-----------------------Summary of Estimated Coefficients------------------------
      Variable       Coef    Std Err     t-stat    p-value    CI 2.5%   CI 97.5%
--------------------------------------------------------------------------------
             x    -0.1032     0.0058     -17.65     0.0000    -0.1146    -0.0917
     intercept     6.6537     0.5189      12.82     0.0000     5.6366     7.6707
---------------------------------End of Summary---------------------------------
con.close()
I’m not sure how much information I really got out of this, but I am pleasantly surprised that the house held it’s heat as well as it did even with the very cold temperatures. It might be interesting to intentionally turn off the heater in the middle of winter and examine these relationship for a longer period and without the influence of the sun.
And I’ve enjoyed learning a new set of tools for data analysis. Thanks to my friend Ryan for recommending them.
New antenna
After the digital television transition several years ago, we bought an omnidirectional antenna from RadioShack and I mounted it on the rear eave of the house. It’s plastic and is saucer shaped. As the snow collected on it this winter we started losing the signal, so last weekend I tried to clear the snow off it, as I did last year, by gently shaking the mast until the snow slid off. This time, as the snow slid toward the edge, it put too much pressure on the bottom of the disc, where it’s screwed onto an L-shaped bracket that holds it to the mast. The plastic broke, it’s now tilted about 45 degrees, and probably won’t survive another winter. And, it’s still having trouble picking up even our strongest station.
A recent post on Lifehacker about a powerful interior antenna (the Mohu Leaf) resulted in an Internet investigation of antennas and whether something like the Leaf would work for us. I didn’t think it would for two reasons: our house has foil-backed insulation and reflective glass windows, and half our stations are in the high-VHF range (7–13) which isn’t what the Leaf is designed to pick up.
Here are the details of our television stations in Fairbanks:
| Station (network) | Channel | Frequency (MHz) | Direction |
|---|---|---|---|
| KFXF (FOX/CBS) | 7 | 174–180 | 44° |
| KUAC (PBS) | 9 | 186–192 | 43° |
| KATN (ABC/CW) | 18 | 494-500 | 44° |
| KTVF (NBC) | 26 | 542–548 | 238° |
KUAC is only three miles away, and the rest of the stations are about five miles from the house. Two stations are high-VHF and the other two are UHF.
My plan was to build either a DB-4 or M-4 style UHF antenna (lots of plans are available on the Internet if you search for those two terms) and then add a VHF dipole to improve FOX and PBS.
Before I went to the trouble of building something complex like the DB-4 / M-4, I thought I’d start with a simple folded half-loop dipole designed for the range in between channels 7 and 9. If that got me KFXF and KUAC, I’d know what I needed to add to the UHF antenna to pick them up. Magically, the dipole was all I needed.
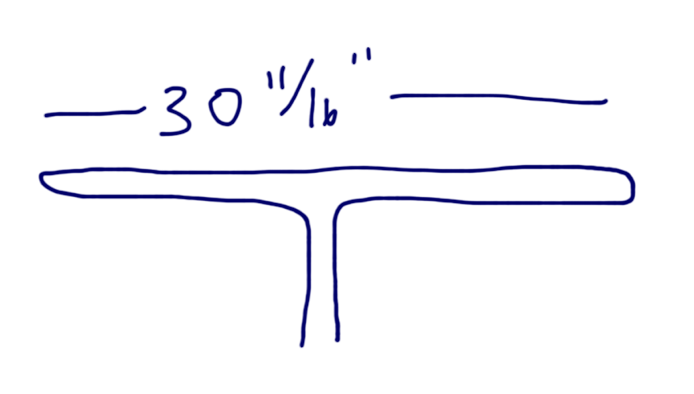
You can read about the theory and calculations on the Internet, but the length of the dipole (in inches) can be found with the following equation: 468 / MHz * 12". For the middle of channels 7 and 9, this works out to a dipole length of 30 11/16". This could be built in a variety of ways, but I chose a folded half-loop configuration, which means a single piece of wire, bent to form a loop stretched such that it’s 30 and 11/16th inches from tip to tip. The two ends of the wire are connected to the two leads of a 300 to 75 Ohm balun transformer (RadioShack part 15-1230), which typically has a coaxial connection on the other end.
Here’s a schematic:
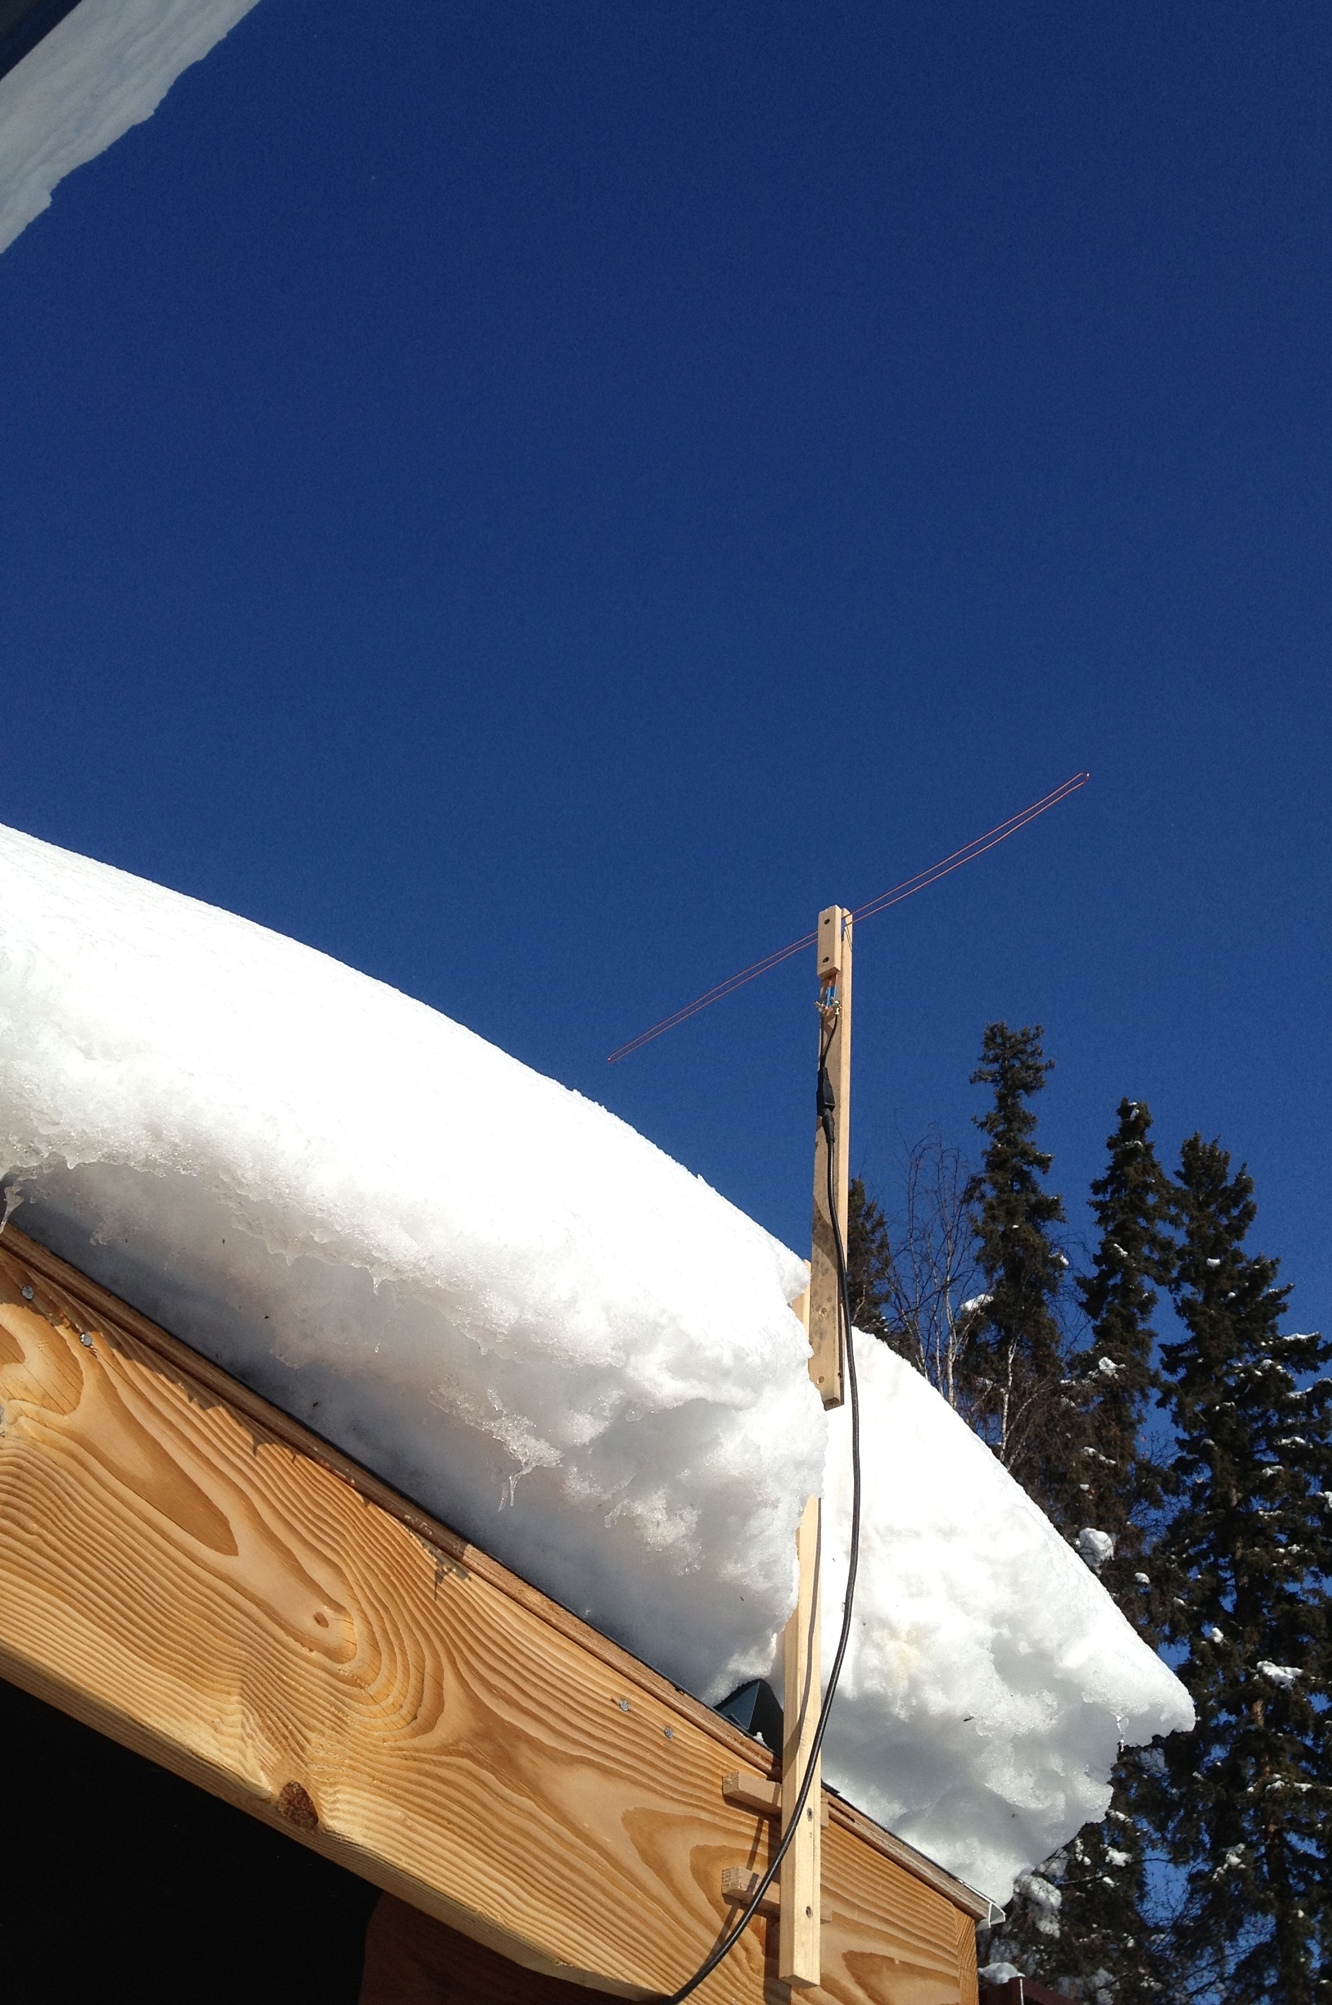
I made mine from the bare wire inside a 72" section of 12-2 Romex, bending the ends around a screwdriver, which resulted in a separation of about 3/4" between the top and bottom of the loop. Each end was twisted around a brass screw, and tightened with the transformer tabs between two brass washers. The center of the dipole was screwed between two pieces of wood for support, and screwed to the roof of the arctic entryway. The photo shows the antenna and support. The main roof of the house is in the upper left corner.
I tested it in two orientations, one where each dipole was pointed at the stations, and one where it was perpendicular to the stations. Based on the signal strength numbers, I got slightly better results when it was close to perpendicular.
Surprisingly, this single loop of copper wire is all that we needed to pick up all the stations in our area. I got a signal strength of 100 for KUAC and KTVF, 84 for KFXF and 78 for KATN. Not bad for a $6 transformer and six feet of surplus wire!

Snowmachine trespass
It's great living where we do: in the middle of nowhere, and yet, only a few miles from town. I can ski to work in the winter on the multi-use commuter trail across the street from our driveway and ride my bike on the road in the summer.
If there is a down side to living where we do it's that it feels like the middle of nowhere to those who think it's their right to drive their gasoline-powered vehicles wherever they want. Several years ago I put up a pair of signs on one of our trails after a four wheeler damaged the vegetation around the trail. And miraculously, that seems to have worked.
Now we've got snowmachines (snowmobiles) riding down the road, which is illegal, then crossing onto the powerline, which is private property. Golden Valley Electric Association has a right of way easement, but it is still my property. In a different time and place it's the sort of thing that might be solved by shooting the offenders with a rock salt-loaded shotgun.
I took a more measured approach and stuck a pair of poles in the snow where they blew across the driveway in attempt to indicate that this isn't an acceptable place to drive their machines. Today they made a new track next to the poles, and knocked one of them over for good measure (the photo above).
And, keep in mind, there's a snowmachine-friendly trail across the street!
I know this is a fight I can't win, so I should just ignore it. And that's what I'll do after making this plea: if any of you ride snowmachines or know others that do, please encourage them to respect private property, including powerlines. Asshats like those riding roughshod all over my property give considerate riders a bad name.
Hot water supply, Rescue Tape
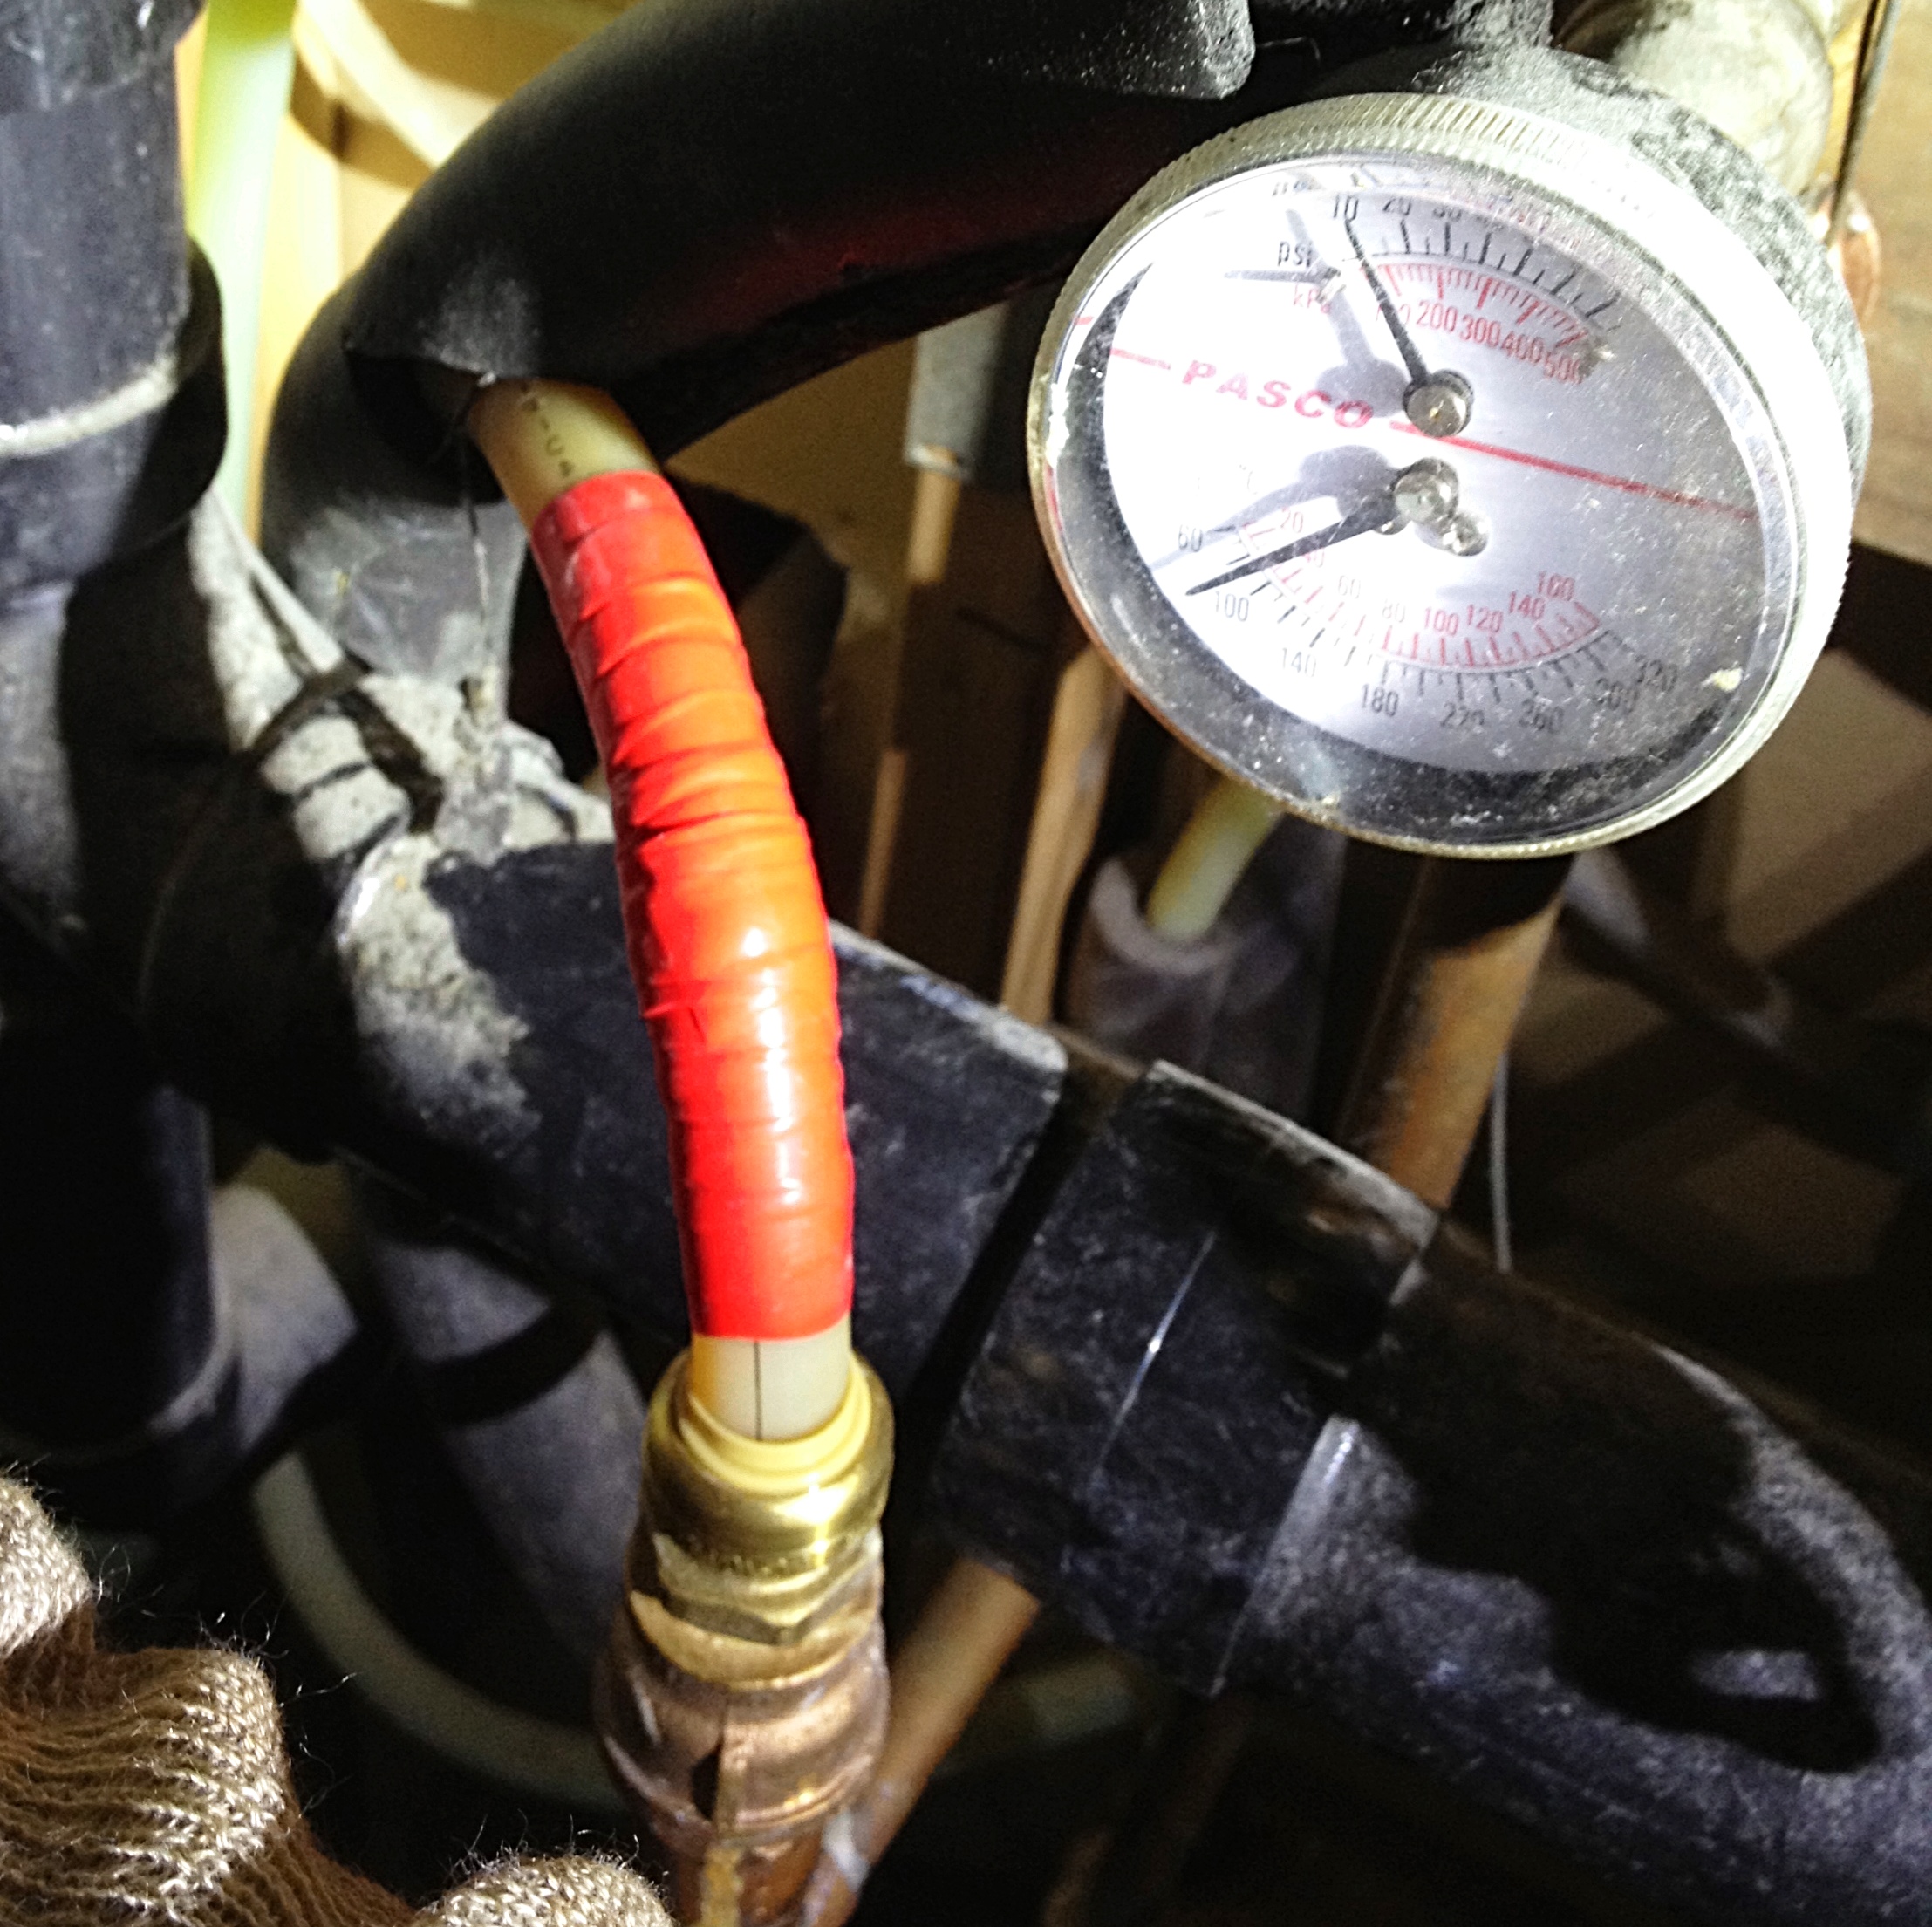
Sitting on the couch watching the Giants v. 49ers, I heard a hissing noise coming from the bathroom—and not the kind that comes from battling cats. When I went to look, there was hot water and steam spraying out of the hot water supply line coming out of our water heater. We’ve got a copper line coming out of the heater into a T-fitting that supplies hot water to a heat exchanger that circulates glycol on the other side of the exchanger to keep our water and septic lines thawed. After that is a Shark Bite connector holding the main PEX hot water line to the house. The leak was coming from just above the connector, underneath some red electrical tape I had always assumed was to indicate “hot,” but may have been there to disguise an injury to the tubing. I don’t know how else to explain PEX suddenly springing a leak, and the contractor that did the original work has a very bad reputation around Fairbanks for doing much less than the “Best.”
At the Fair this summer we stopped at the booth advertising Rescue Tape and bought a couple rolls. It's a silicone “tape” that bonds with itself when stretched, and can supposedly handle very high pressures and temperatures. I’m very glad we did. I wrapped a foot-long section around the leak, and for now, it’s holding. If you don’t have a roll of this stuff around, you may want to get one for a similar emergency.

The deck, 2011-10-15
It's been forever since I've made a blog post, mostly because I've spent the last three months building a new deck on our house. We had a deck on the south and east sides of the house, but after building the arctic entryway last summer, the part of the deck on the east side had to be removed. For this project, I added a new deck in front of the arctic entryway that connects to the part of the old deck that's on the south side of the house, and replaced all of the old deck boards on that section of the deck. This was a lot of work. I don't have the exact number but I've driven more than 2,500 screws in the last three months, and removed at least a third of that many pulling up the old decking.
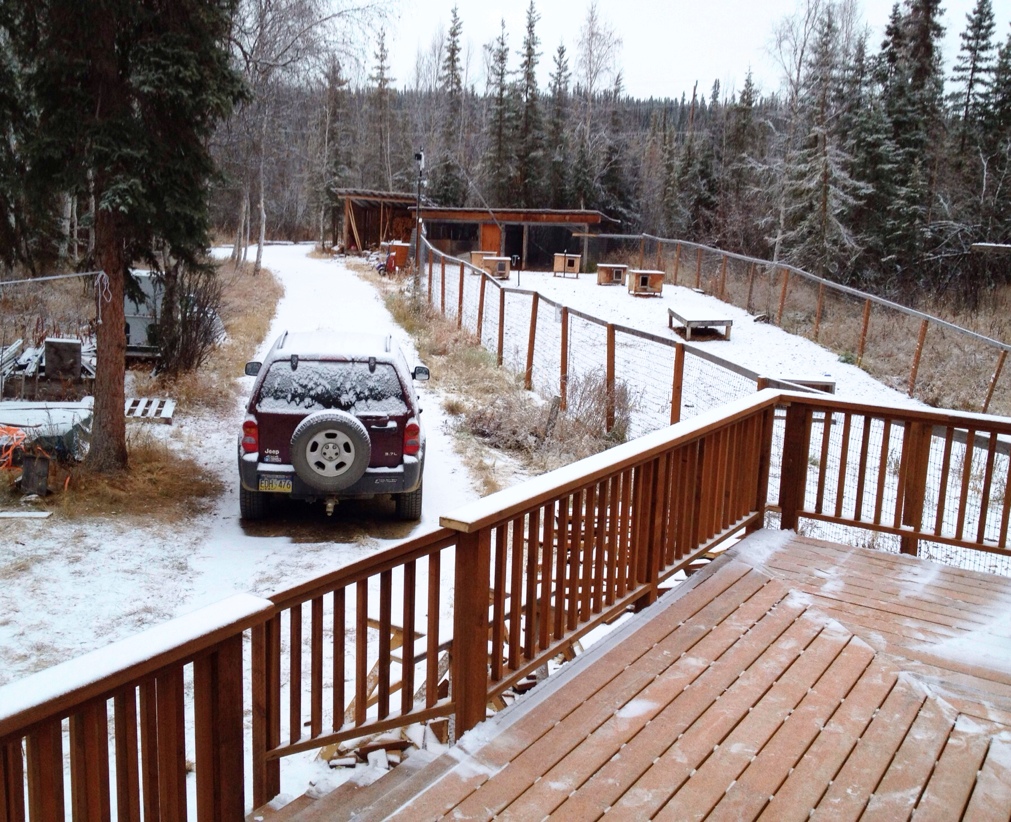
I finished the stairs and stair railings on the entry section of the deck yesterday just in time; this morning we had a quarter of an inch of snow on the ground.
The top photo shows what the deck looked like yesterday, the bottom photo shows what it looked like this morning.
I bought one new tool for this project, a Ridgid cordless drill. This was because the deck screws from the old part of the deck were Phillips head and I knew I wanted to use square drive screws for the new sections. I figured I would use my corded drill to drive the new screws, and the cordless drill to remove the old ones. It turned out that the old screws were both Phillips and square drive so I only needed one drill. I used the cordless. It was fantastic. One big improvement over the corded drill, that I didn't realize is that it has a much higher RPM, which means it's much faster to drive (or remove) screws. Add to that the lighter weight and that I didn't have to drag a cord around and it's now one of my favorite tools. The only thing that managed to bog it down was drilling half-inch holes through wet pressure-treated 4x4s.
The deck, 2011-10-16