Friday night we got 2.4 inches of snow at home, after a storm earlier in the week dropped a total of 6.9 inches of snow (0.51 inches of liquid). I plowed the road on Wednesday afternoon after most of that first storm’s snow had fallen and got up Saturday morning debating about whether I should plow again. My normal rule is if we get more than two inches I’ll plow, but I didn’t feel like it and left it. It’s snowing again today, so I will probably wind up plowing soon.
Feeling somewhat responsible for keeping the road clear makes winter something of a mixed bag for me because I enjoy the snow in the winter, but the drudgery of plowing turns snow storms into work. I remember plowing three times in the span of a week before Thanksgiving one year, and everyone in Fairbanks remembers Christmas 2021 when we had a major storm with both rain and snow, following by extreme cold, and most people were stuck at home until they could dig out. Our four wheeler was out of commission with a burned up rear differential, so I couldn’t do anything about it.
I thought it would be interesting to look at the storm data for Fairbanks. I’m defining a “storm” as any period with one or more consecutive days with precipitation, and by “precipitation” I mean either rain, or the liquid when daily snowfall is melted. I am not including “trace” precipitation (snowfall less than a tenth of an inch or liquid less than 0.01 inches) in this calculation.
Here’s a table of the top ten storms in Fairbanks, ranked by total precipitation.
| Rank | Start | Days | Total Snow (inches) | Total Precip (inches) | Per Day Snow | Per Day Precip |
|---|---|---|---|---|---|---|
| 1 | 1967‑08‑08 | 8 | 0.00 | 6.15 | 0.00 | 0.77 |
| 2 | 2003‑07‑26 | 11 | 0.00 | 4.57 | 0.00 | 0.42 |
| 3 | 1937‑01‑18 | 12 | 38.15 | 4.17 | 3.18 | 0.35 |
| 4 | 1990‑07‑07 | 7 | 0.00 | 3.98 | 0.00 | 0.57 |
| 5 | 2021‑12‑25 | 5 | 23.39 | 3.67 | 4.68 | 0.73 |
| 6 | 2019‑07‑28 | 11 | 0.00 | 3.59 | 0.00 | 0.33 |
| 7 | 2014‑06‑30 | 3 | 0.00 | 3.37 | 0.00 | 1.12 |
| 8 | 1948‑07‑18 | 7 | 0.00 | 3.18 | 0.00 | 0.45 |
| 9 | 1932‑08‑02 | 7 | 0.00 | 3.14 | 0.00 | 0.45 |
| 10 | 1962‑08‑25 | 6 | 0.00 | 3.09 | 0.00 | 0.52 |
A couple storms stand out to me. First, the Christmas 2021 event is 5th on the list (it winds up 13th on the list of winter storms ranked by total snowfall instead of liquid precipitation). It’s so high on this list because a significant amount of the total precipitation in that storm came as rain.
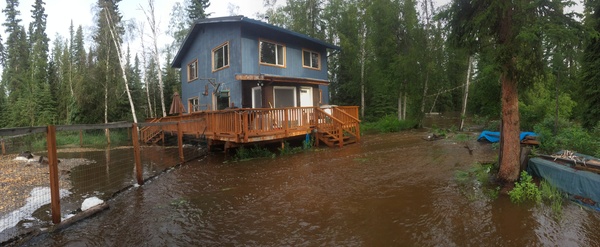
The other remarkable storm for me is the three day rainstorm that started on June 30th, 2014 and ended on July 2nd. We got a remarkable 1.12 inches of rain per day over those three days, and on July 2nd Goldstream Creek went over the banks at our house. Here’s a ranking of storms by average daily precipitation.
| Rank | Start | Days | Per Day Precip (inches) |
|---|---|---|---|
| 1 | 2014-07-07 | 1 | 1.13 |
| 2 | 2014-06-30 | 3 | 1.12 |
| 3 | 2014-09-01 | 2 | 1.12 |
| 4 | 1953-06-24 | 1 | 1.08 |
| 5 | 1992-07-06 | 1 | 0.95 |
The top three storms are all from the summer 2014.
There is evidence that one of the consequences of climate change in Alaska is an increase in the severity of storms. Here’s a ranking of the number of top 50 storms in each decade. The previous decade leads the list, and our current decade already has 2 such top 50 storms. Changing the minimum ranking from top 50 to top 100 doesn’t change the list much, and 2010‒2019 is a the top of that ranking as well.
| Decade | Number of Top 50 Storms |
|---|---|
| 2010‒2019 | 9 |
| 1920‒1929 | 7 |
| 1930‒1939 | 7 |
| 1940‒1949 | 6 |
| 1960‒1969 | 4 |
| 2000‒2009 | 4 |
| 1990‒1999 | 3 |
| 1910‒1919 | 2 |
| 1950‒1959 | 2 |
| 1970‒1979 | 2 |
| 1980‒1989 | 2 |
| 2020‒2023 | 2 |
Introduction
Yesterday Richard James posted about “hythergraphs”, which he’d seen on Toolik Field Station’s web site.
Hythergraphs show monthly weather parameters for an entire year, plotting temperature against precipitation (or other paired climate variables) against each other for each month of the year, drawing a line from month to month. When contrasting one climate record against another (historic vs. contemporary, one station against another), the differences stand out.
I was curious to see how easy it would be to produce one with R and ggplot.
Data
I’ll produce hythergraphs, one that compares Fairbanks Airport data against the data collected at our station on Goldstream Creek for the period of record for our station (2011‒2022) and one that compares the Fairbanks Airport station data from 1951‒2000 against data from 2001‒2022 (similar to what Richard did).
I’m using the following R packages:
library(tidyverse)
library(RPostgres)
library(lubridate)
library(scales)
I’ll skip the part where I pull the data from the GHCND database. What we need is a table of observations that look like this. We’ve got a categorical column (station_name), a date column, and the two climate variables we’re going to plot:
# A tibble: 30,072 × 4
   station_name     dte         PRCP   TAVG
   <chr>            <date>     <dbl>  <dbl>
   1 GOLDSTREAM CREEK 2011-04-01   0   -17.5
   2 GOLDSTREAM CREEK 2011-04-02   0   -15.6
   3 GOLDSTREAM CREEK 2011-04-03   0    -8.1
   4 GOLDSTREAM CREEK 2011-04-04   0    -5
   5 GOLDSTREAM CREEK 2011-04-05   0    -5
   6 GOLDSTREAM CREEK 2011-04-06   0.5  -3.9
   7 GOLDSTREAM CREEK 2011-04-07   0    -8.3
   8 GOLDSTREAM CREEK 2011-04-08   2    -5.85
   9 GOLDSTREAM CREEK 2011-04-09   0.5  -1.65
  10 GOLDSTREAM CREEK 2011-04-10   0    -4.45
# ℹ 30,062 more rows
From that raw data, we’ll aggregate to year and month, calculating the montly precipitation sum and mean average temperature, then aggregate to station and month, calculating the mean monthly precipitation and temperature.
The final step adds the necessary aesthetics to produce the plot using ggplot. We’ll draw the monthly scatterplot values using the first letter of the month, calculated using month_label = substring(month.name[month], 1, 1) below. To draw the lines from one month to the next we use geom_segement and calculate the ends of each segment by setting xend and yend to the next row’s value from the table.
One flaw in this approach is that there’s no line between December and January because there is no “next” value in the data frame. This could be fixed by seperately finding the January positions, then passing those to lead() as the default value (which is normally NA).
airport_goldstream <- pivot |>
   filter(dte >= "2010-04-01") |>
   # get monthly precip total, mean temp
   mutate(
      year = year(dte),
      month = month(dte)
   ) |>
   group_by(station_name, year, month) |>
   summarize(
      sum_prcp_in = sum(PRCP, na.rm = TRUE) / 25.4,
      mean_tavg_f = mean(TAVG, na.rm = TRUE) * 9 / 5.0 + 32,
      .groups = "drop"
   ) |>
   # get monthy means for each station
   group_by(station_name, month) |>
   summarize(
      mean_prcp_in = mean(sum_prcp_in),
      mean_tavg_f = mean(mean_tavg_f),
      .groups = "drop"
   ) |>
   # add month label, line segment ends
   arrange(station_name, month) |>
   group_by(station_name) |>
   mutate(
      month_label = substring(month.name[month], 1, 1),
      xend = lead(mean_prcp_in),
      yend = lead(mean_tavg_f)
   )
Here’s what that data frame looks like:
# A tibble: 24 × 7
# Groups:   station_name [2]
   station_name      month mean_prcp_in mean_tavg_f month_label  xend   yend
   <chr>             <dbl>        <dbl>       <dbl> <chr>       <dbl>  <dbl>
   1 FAIRBANKS INTL AP     1        0.635      -6.84  J           0.988 -0.213
   2 FAIRBANKS INTL AP     2        0.988      -0.213 F           0.635 11.5
   3 FAIRBANKS INTL AP     3        0.635      11.5   M           0.498 33.1
   4 FAIRBANKS INTL AP     4        0.498      33.1   A           0.670 51.2
   5 FAIRBANKS INTL AP     5        0.670      51.2   M           1.79  61.3
   6 FAIRBANKS INTL AP     6        1.79       61.3   J           2.41  63.1
   7 FAIRBANKS INTL AP     7        2.41       63.1   J           2.59  57.9
   8 FAIRBANKS INTL AP     8        2.59       57.9   A           1.66  46.5
   9 FAIRBANKS INTL AP     9        1.66       46.5   S           1.04  29.5
  10 FAIRBANKS INTL AP    10        1.04       29.5   O           1.16   5.21
# ℹ 14 more rows
Plots
Here’s the code to produce the plot. The month labels are displayed using geom_label, and the lines between months are generated from geom_segment.
airport_v_gsc <- ggplot(
   data = airport_goldstream,
   aes(x = mean_prcp_in, y = mean_tavg_f, color = station_name)
) +
   theme_bw() +
   geom_segment(aes(xend = xend, yend = yend, color = station_name)) +
   geom_label(aes(label = month_label), show.legend = FALSE) +
   scale_x_continuous(
      name = "Monthly Average Precipitation (inches liquid)",
      breaks = pretty_breaks(n = 10)
   ) +
   scale_y_continuous(
      name = "Monthly Average Tempearature (°F)",
      breaks = pretty_breaks(n = 10)
   ) +
   scale_color_manual(
      name = "Station",
      values = c("darkorange", "darkcyan")
   ) +
   theme(
      legend.position = c(0.8, 0.2),
      legend.background = element_rect(
      fill = "white", linetype = "solid", color = "grey80", size = 0.5
      )
   ) +
   labs(
      title = "Monthly temperature and precipitation",
      subtitle = "Fairbanks Airport and Goldstream Creek Stations, 2011‒2022"
   )
You can see from the plot that we are consistently colder than the airport, curiously more dramatically in the summer than winter. The airport gets slighly more precipitation in winter, but our summer precipitation is significantly higher, especially in August.
The standard plot to display this information would be two bar charts with one plot showing the monthly mean temperature for each station, and a second plot showing precipitation. The advantage of such a display is that the differences would be more clear, and the bars could include standard errors (or standard deviation) that would help provide an idea of whether the differences between stations are statistically significant or not.
For example (the lines above the bars are one standard deviation above or below the mean):
In this plot of the same data, you can tell from the standard deviation lines that the precipitation differences between stations are probably not significant, but the cooler summer temperatures at Goldstrem Creek may be.
If we calculate the standard deviations of the monthly means, we can use geom_tile to draw significance boxes around each monthly value in the hytherplot as Richard suggests in his post. Here’s the ggplot geom to do that:
geom_tile(
  aes(width = 2*sd_prcp_in, height = 2*sd_tavg_f, fill = station_name),
  show.legend = FALSE, alpha = 0.25
) +
And the updated plot:
This clearly shows the large variation in precipitation, and if you carefully compare the boxes for a particular month, you can draw concusions similar to what is made fairly clear in the bar charts. For example, if we focus on August, you can see that the Goldstream Creek precipitation box clearly overlaps that of the airport station, but the temperature ranges do not overlap, suggesting that August temperatures are cooler at Goldstream Creek but that while precipitation is much higher, it’s not statistically significant.
Airport station, different time periods
Here’s the plot for the airport station that is similar to the plot Richard created (I used different time periods).
This plot demonstrates that while temperatures have increased in the last two decades, it’s the differences in the pattern of precipitation that stands out, with July and August precipitation much larger in the last 20 years. It’s also curious that February and April precipitation is higher, but the differences are smaller in the other winter months. This is a case where some sense of the distribution of the values would be useful.
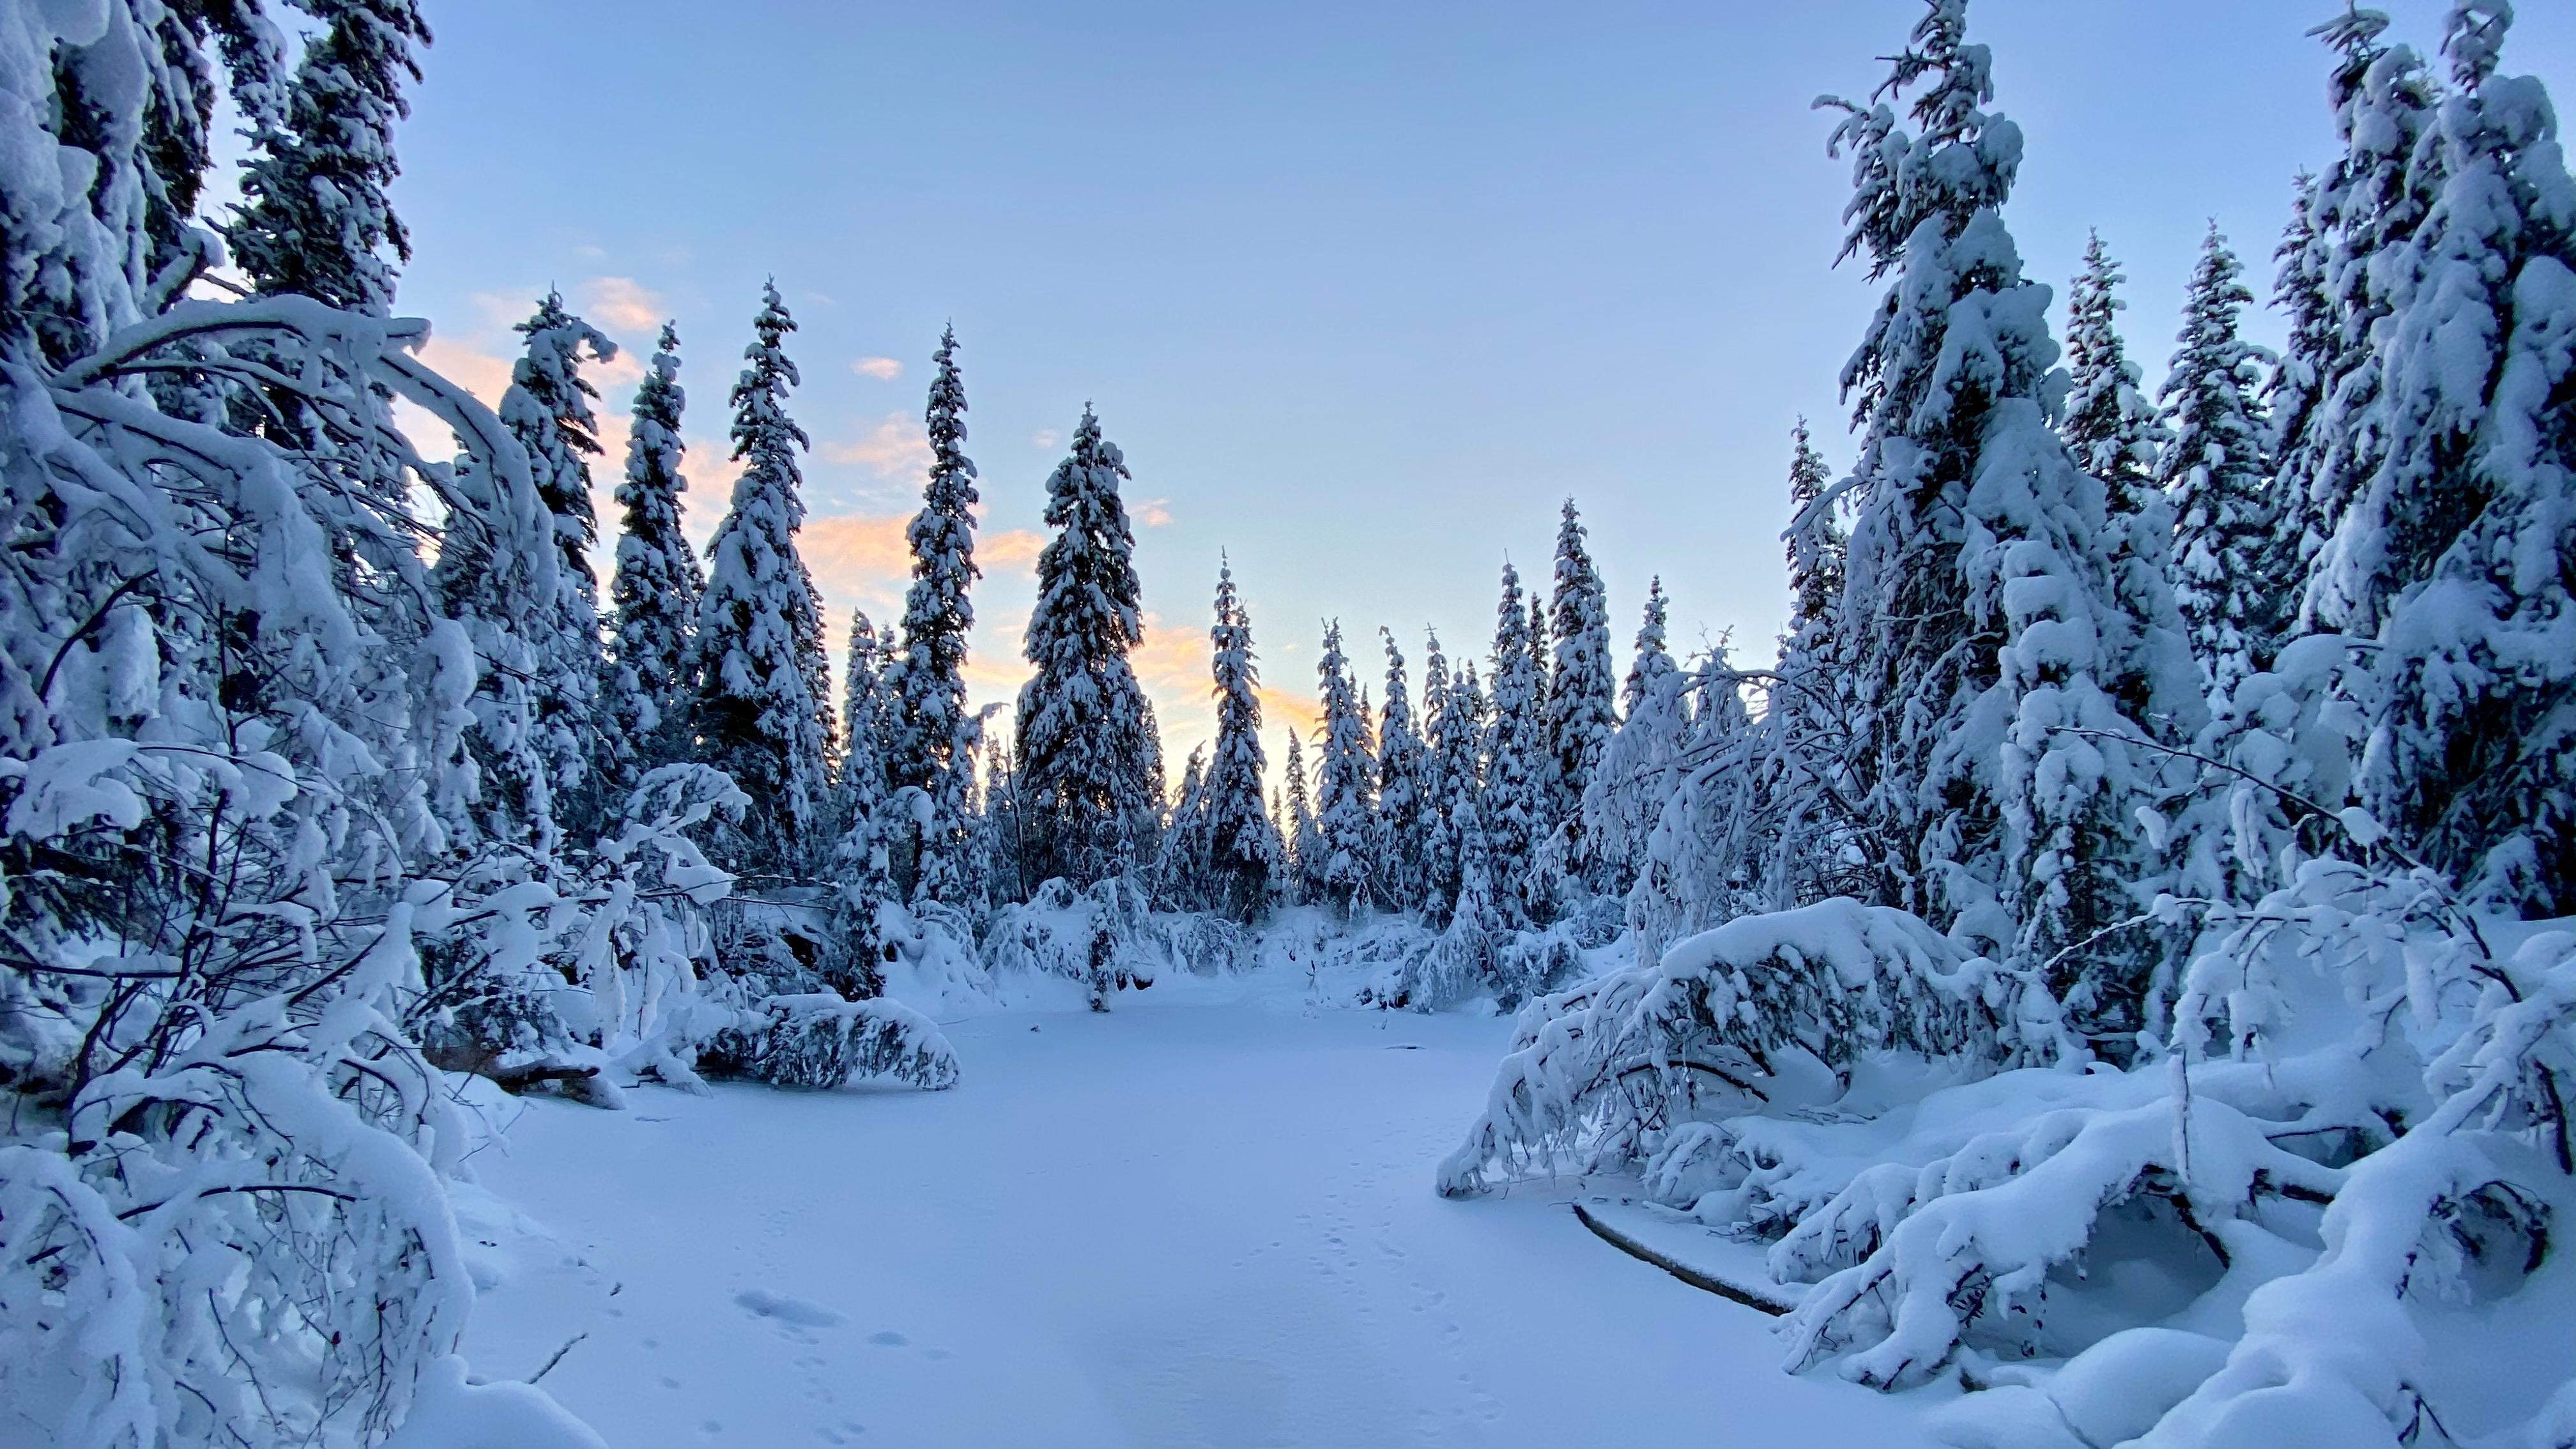
Yesterday I went for my first run on Goldstream Creek this winter and noted a very smooth descending line on the elevation diagram from my Garmin watch while I was on the creek. There was a significant overflow event on November 29th, and with the cold temperatures since then, the water on the surface froze solid.
Here’s the plot of creek height and temperature for the last seven days. You can see the overflow event on November 29th, and a sudden drop starting yesterday afternoon.
Usually when there are overflow events like this they are fairly restricted, overflowing in one place for a thousand feet or so, freezing, then overflowing somewhere else. But this event was large enough that I was running on clean ice for almost the entire time I was down on the Creek. In winter, I run with Black Diamond Distance Spikes, and barely slip at all, even on smooth ice.
Here’s the map of my run.
And the elevation diagram. You can clearly see where I dropped down onto the Creek at the end of Miller Hill/Miller Hill Extension at a quarter mile, and then came back up at the Murkowski cabin near mile 2¼. The orange line shows a fitted line to the elevation points while I was down on the Creek.
When I dropped down on the Creek at the end of Miller Hill and Miller Hill Extension, the elevation of the Creek was 562 feet, and 1.9 miles downstream it was down twelve feet to 550. The slope of the line is -5.876, indicating that the Creek drops almost six feet per mile along the course I ran.
Something happened to the ice overnight, at least at our house, so it’ll be interesting to check it out on my run today. The overflow on November 29th was around 4 inches deep, and last night it dropped almost the same amount. Since the surface is frozen, there must have been a layer of air under the ice that was filled with water earlier in the week, but after the water overflowed (and froze), that layer emptied and the ice on the surface dropped back down.
Introduction
Several years ago I wrote a post about Equinox Marathon weather, summarizing the conditions for all 50+ races. Since that post Andrea and I have run the relay twice, and I’ve run the full marathon three more times (if I include last year’s COVID-19 cancelled race). Despite no official race last year, quite a few people came out to run it in the rain and fog. This post updates the statistics and plots to include last year’s weather data.

Conditions on Ester Dome during the 2020 marathon
Methods
Methods and data are the same as in my previous post, except the daily data has been updated to include years through 2020. The R code is available at the end of the previous post.
Results
Race day weather
Temperatures at the airport on race day ranged from 19.9 °F in 1972 to 68 °F in 1969, but the average range is between 34.5 and 53.0 °F. Using our model of Ester Dome temperatures, we get an average range of 29.8 and 47.3 °F and an overall min / max of 16.1 / 61.3 °F up on the Dome. Generally speaking, it will be below freezing on Ester Dome, but usually before most of the runners get up there.
Precipitation (rain, sleet or snow) has fallen on 18 out of 58 race days, or 31% of the time, and measurable snowfall has been recorded on four of those eighteen. The highest amount fell in 2014 with 0.36 inches of liquid precipitation (no snow was recorded and the temperatures were between 45 and 51 °F so it was almost certainly all rain, even on Ester Dome). More than a quarter of an inch of precipitation fell in three of the eighteen years when it rained or snowed (1990, 1993, and 2014), but most rainfall totals are much smaller.
Measurable snow fell at the airport in four years, or seven percent of the time: 4.1 inches in 1993, 2.1 inches in 1985, 1.2 inches in 1996, and 0.4 inches in 1992. But that’s at the airport station. Five of the 14 years where measurable precipitation fell at the airport and no snow fell, had possible minimum temperatures on Ester Dome that were below freezing. It’s likely that some of the precipitation recorded at the airport in those years was coming down as snow up on Ester Dome. If so, that means snow may have fallen on nine race days, bringing the percentage up to sixteen percent.
Wind data from the airport has only been recorded since 1984, but from those years the average wind speed at the airport on race day is 4.8 miles per hour. The highest 2-minute wind speed during Equinox race day was 21 miles per hour in 2003. Unfortunately, no wind data is available for Ester Dome, but it’s likely to be higher than what is recorded at the airport.
Weather from the week prior
It’s also useful to look at the weather from the week before the race, since excessive pre-race rain or snow can make conditions on race day very different, even if the race day weather is pleasant. The first year I ran the full marathon (2013), it snowed the week before and much of the trail in the woods before the water stop near Henderson and all of the out and back were covered in snow.
The most dramatic example of this was 1992 where 23 inches (!) of snow fell at the airport in the week prior to the race, with much higher totals up on the summit of Ester Dome. Measurable snow has been recorded at the airport in the week prior to six races, but all the weekly totals are under an inch except for the snow year of 1992.
Precipitation has fallen in 46 of 58 pre-race weeks (79% of the time). Three years have had more than an inch of precipitation prior to the race: 1.49 inches in 2015, 1.26 inches in 1992 (most of which fell as snow), and 1.05 inches in 2007. On average, just over two tenths of an inch of precipitation falls in the week before the race.
Summary
The following stacked plots shows the weather for all 58 runnings of the Equinox marathon. The top panel shows the range of temperatures on race day from the airport station (wide bars) and estimated on Ester Dome (thin lines below bars). The shaded area at the bottom shows where temperatures are below freezing. The orange horizonal lines represent average high and low temperature in the valley (dashed lines) and on Ester Dome (solid orange lines).
The middle panel shows race day liquid precipitation (rain, melted snow). Bars marked with an asterisk indicate years where snow was also recorded at the airport, but remember that five of the other years with liquid precipitation probably experienced snow on Ester Dome (1977, 1986, 1991, 1994, and 2016) because the temperatures were likely to be below freezing at elevation.
The bottom panel shows precipitation totals from the week prior to the race. Bars marked with an asterisk indicate weeks where snow was also recorded at the airport.

Here’s a table with most of the data from the analysis.
| Date | min t | max t | ED min t | ED max t | awnd | prcp | snow | p prcp | p snow |
|---|---|---|---|---|---|---|---|---|---|
| 1963-09-21 | 32.0 | 54.0 | 27.5 | 48.2 | 0.00 | 0.0 | 0.01 | 0.0 | |
| 1964-09-19 | 34.0 | 57.9 | 29.4 | 51.8 | 0.00 | 0.0 | 0.03 | 0.0 | |
| 1965-09-25 | 37.9 | 60.1 | 33.1 | 53.9 | 0.00 | 0.0 | 0.80 | 0.0 | |
| 1966-09-24 | 36.0 | 62.1 | 31.3 | 55.8 | 0.00 | 0.0 | 0.01 | 0.0 | |
| 1967-09-23 | 35.1 | 57.9 | 30.4 | 51.8 | 0.00 | 0.0 | 0.00 | 0.0 | |
| 1968-09-21 | 23.0 | 44.1 | 19.1 | 38.9 | 0.00 | 0.0 | 0.04 | 0.0 | |
| 1969-09-20 | 35.1 | 68.0 | 30.4 | 61.3 | 0.00 | 0.0 | 0.00 | 0.0 | |
| 1970-09-19 | 24.1 | 39.9 | 20.1 | 34.9 | 0.00 | 0.0 | 0.42 | 0.0 | |
| 1971-09-18 | 35.1 | 55.9 | 30.4 | 50.0 | 0.00 | 0.0 | 0.14 | 0.0 | |
| 1972-09-23 | 19.9 | 42.1 | 16.1 | 37.0 | 0.00 | 0.0 | 0.01 | 0.2 | |
| 1973-09-22 | 30.0 | 44.1 | 25.6 | 38.9 | 0.00 | 0.0 | 0.05 | 0.0 | |
| 1974-09-21 | 48.0 | 60.1 | 42.5 | 53.9 | 0.08 | 0.0 | 0.00 | 0.0 | |
| 1975-09-20 | 37.9 | 55.9 | 33.1 | 50.0 | 0.02 | 0.0 | 0.02 | 0.0 | |
| 1976-09-18 | 34.0 | 59.0 | 29.4 | 52.9 | 0.00 | 0.0 | 0.54 | 0.0 | |
| 1977-09-24 | 36.0 | 48.9 | 31.3 | 43.4 | 0.06 | 0.0 | 0.20 | 0.0 | |
| 1978-09-23 | 30.0 | 42.1 | 25.6 | 37.0 | 0.00 | 0.0 | 0.10 | 0.3 | |
| 1979-09-22 | 35.1 | 62.1 | 30.4 | 55.8 | 0.00 | 0.0 | 0.17 | 0.0 | |
| 1980-09-20 | 30.9 | 43.0 | 26.5 | 37.8 | 0.00 | 0.0 | 0.35 | 0.0 | |
| 1981-09-19 | 37.0 | 43.0 | 32.2 | 37.8 | 0.15 | 0.0 | 0.04 | 0.0 | |
| 1982-09-18 | 42.1 | 61.0 | 37.0 | 54.8 | 0.02 | 0.0 | 0.22 | 0.0 | |
| 1983-09-17 | 39.9 | 46.9 | 34.9 | 41.5 | 0.00 | 0.0 | 0.05 | 0.0 | |
| 1984-09-22 | 28.9 | 60.1 | 24.6 | 53.9 | 5.8 | 0.00 | 0.0 | 0.08 | 0.0 |
| 1985-09-21 | 30.9 | 42.1 | 26.5 | 37.0 | 6.5 | 0.14 | 2.1 | 0.57 | 0.0 |
| 1986-09-20 | 36.0 | 52.0 | 31.3 | 46.3 | 8.3 | 0.07 | 0.0 | 0.21 | 0.0 |
| 1987-09-19 | 37.9 | 61.0 | 33.1 | 54.8 | 6.3 | 0.00 | 0.0 | 0.00 | 0.0 |
| 1988-09-24 | 37.0 | 45.0 | 32.2 | 39.7 | 4.0 | 0.00 | 0.0 | 0.11 | 0.0 |
| 1989-09-23 | 36.0 | 61.0 | 31.3 | 54.8 | 8.5 | 0.00 | 0.0 | 0.07 | 0.5 |
| 1990-09-22 | 37.9 | 50.0 | 33.1 | 44.4 | 7.8 | 0.26 | 0.0 | 0.00 | 0.0 |
| 1991-09-21 | 36.0 | 57.0 | 31.3 | 51.0 | 4.5 | 0.04 | 0.0 | 0.03 | 0.0 |
| 1992-09-19 | 24.1 | 33.1 | 20.1 | 28.5 | 6.7 | 0.01 | 0.4 | 1.26 | 23.0 |
| 1993-09-18 | 28.0 | 37.0 | 23.8 | 32.2 | 4.9 | 0.29 | 4.1 | 0.37 | 0.3 |
| 1994-09-24 | 27.0 | 51.1 | 22.8 | 45.5 | 6.0 | 0.02 | 0.0 | 0.08 | 0.0 |
| 1995-09-23 | 43.0 | 66.9 | 37.8 | 60.3 | 4.0 | 0.00 | 0.0 | 0.00 | 0.0 |
| 1996-09-21 | 28.9 | 37.9 | 24.6 | 33.1 | 6.9 | 0.06 | 1.2 | 0.26 | 0.0 |
| 1997-09-20 | 27.0 | 55.0 | 22.8 | 49.1 | 3.8 | 0.00 | 0.0 | 0.03 | 0.0 |
| 1998-09-19 | 42.1 | 60.1 | 37.0 | 53.9 | 4.9 | 0.00 | 0.0 | 0.37 | 0.0 |
| 1999-09-18 | 39.0 | 64.9 | 34.1 | 58.4 | 3.8 | 0.00 | 0.0 | 0.26 | 0.0 |
| 2000-09-16 | 28.9 | 50.0 | 24.6 | 44.4 | 5.6 | 0.00 | 0.0 | 0.30 | 0.0 |
| 2001-09-22 | 33.1 | 57.0 | 28.5 | 51.0 | 1.6 | 0.00 | 0.0 | 0.00 | 0.0 |
| 2002-09-21 | 33.1 | 48.9 | 28.5 | 43.4 | 3.8 | 0.00 | 0.0 | 0.03 | 0.0 |
| 2003-09-20 | 26.1 | 46.0 | 22.0 | 40.7 | 9.6 | 0.00 | 0.0 | 0.00 | 0.0 |
| 2004-09-18 | 26.1 | 48.0 | 22.0 | 42.5 | 4.3 | 0.00 | 0.0 | 0.25 | 0.0 |
| 2005-09-17 | 37.0 | 63.0 | 32.2 | 56.6 | 0.9 | 0.00 | 0.0 | 0.09 | 0.0 |
| 2006-09-16 | 46.0 | 64.0 | 40.7 | 57.6 | 4.3 | 0.00 | 0.0 | 0.00 | 0.0 |
| 2007-09-22 | 25.0 | 45.0 | 20.9 | 39.7 | 4.7 | 0.00 | 0.0 | 1.05 | 0.0 |
| 2008-09-20 | 34.0 | 51.1 | 29.4 | 45.5 | 4.5 | 0.00 | 0.0 | 0.08 | 0.0 |
| 2009-09-19 | 39.0 | 50.0 | 34.1 | 44.4 | 5.8 | 0.00 | 0.0 | 0.25 | 0.0 |
| 2010-09-18 | 35.1 | 64.9 | 30.4 | 58.4 | 2.5 | 0.00 | 0.0 | 0.00 | 0.0 |
| 2011-09-17 | 39.9 | 57.9 | 34.9 | 51.8 | 1.3 | 0.00 | 0.0 | 0.44 | 0.0 |
| 2012-09-22 | 46.9 | 66.9 | 41.5 | 60.3 | 6.0 | 0.00 | 0.0 | 0.33 | 0.0 |
| 2013-09-21 | 24.3 | 44.1 | 20.3 | 38.9 | 5.1 | 0.00 | 0.0 | 0.13 | 0.6 |
| 2014-09-20 | 45.0 | 51.1 | 39.7 | 45.5 | 1.6 | 0.36 | 0.0 | 0.00 | 0.0 |
| 2015-09-19 | 37.9 | 44.1 | 33.1 | 38.9 | 2.9 | 0.01 | 0.0 | 1.49 | 0.0 |
| 2016-09-17 | 34.0 | 57.9 | 29.4 | 51.8 | 2.2 | 0.01 | 0.0 | 0.61 | 0.0 |
| 2017-09-16 | 33.1 | 66.0 | 28.5 | 59.5 | 3.1 | 0.00 | 0.0 | 0.02 | 0.0 |
| 2018-09-15 | 44.1 | 60.1 | 38.9 | 53.9 | 3.8 | 0.00 | 0.0 | 0.00 | 0.0 |
| 2019-09-21 | 37.0 | 45.0 | 32.2 | 39.7 | 7.6 | 0.13 | 0.0 | 0.40 | 0.0 |
| 2020-09-19 | 39.9 | 53.1 | 34.9 | 47.3 | 2.2 | 0.12 | 0.0 | 0.10 | 0.0 |
Introduction
Several years ago I wrote a post about past Equinox Marathon weather. Since that post Andrea and I have run the relay twice, and I’ve run the full marathon twice. This post updates the statistics and plots to include last year’s weather data.
The official race this year was cancelled due to covid-19, but I will run it anyway, and I have no doubt many others will too. Last year’s race featured rain down in the valley, and high winds and a mixture of snow, sleet, and rain up on Ester Dome.

Conditions on Ester Dome during the 2019 Equinox Marathon
Methods
Methods and data are the same as in my previous post, except the daily data has been updated to include years through 2019. The R code is available at the end of the previous post.
Results
Race day weather
Temperatures at the airport on race day ranged from 19.9 °F in 1972 to 68 °F in 1969, but the average range is between 34.4 and 53.0 °F. Using our model of Ester Dome temperatures, we get an average range of 29.7 and 47.3 °F and an overall min / max of 16.1 / 61.3 °F up on the Dome. Generally speaking, it is below freezing on Ester Dome, but usually before most of the runners get up there.
Precipitation (rain, sleet or snow) has fallen on 17 out of 57 race days, or 30% of the time, and measurable snowfall has been recorded on four of those seventeen. The highest amount fell in 2014 with 0.36 inches of liquid precipitation (no snow was recorded and the temperatures were between 45 and 51 °F so it was almost certainly all rain, even on Ester Dome). More than a quarter of an inch of precipitation fell in three of the seventeen years when it rained or snowed (1990, 1993, and 2014), but most rainfall totals are much smaller.
Measurable snow fell at the airport in four years, or seven percent of the time: 4.1 inches in 1993, 2.1 inches in 1985, 1.2 inches in 1996, and 0.4 inches in 1992. But that’s at the airport station. Five of the 13 years where measurable precipitation fell at the airport and no snow fell, had possible minimum temperatures on Ester Dome that were below freezing. It’s likely that some of the precipitation recorded at the airport in those years was coming down as snow up on Ester Dome. If so, that means snow may have fallen on nine race days, bringing the percentage up to sixteen percent.
Wind data from the airport has only been recorded since 1984, but from those years the average wind speed at the airport on race day is 4.8 miles per hour. The highest 2-minute wind speed during Equinox race day was 21 miles per hour in 2003. Unfortunately, no wind data is available for Ester Dome, but it’s likely to be higher than what is recorded at the airport.
Weather from the week prior
It’s also useful to look at the weather from the week before the race, since excessive pre-race rain or snow can make conditions on race day very different, even if the race day weather is pleasant. The first year I ran the full marathon (2013), it snowed the week before and much of the trail in the woods before the water stop near Henderson and all of the out and back were covered in snow.
The most dramatic example of this was 1992 where 23 inches (!) of snow fell at the airport in the week prior to the race, with much higher totals up on the summit of Ester Dome. Measurable snow has been recorded at the airport in the week prior to six races, but all the weekly totals are under an inch except for the snow year of 1992.
Precipitation has fallen in 45 of 57 pre-race weeks (79% of the time). Three years have had more than an inch of precipitation prior to the race: 1.49 inches in 2015, 1.26 inches in 1992 (most of which fell as snow), and 1.05 inches in 2007. On average, just over two tenths of an inch of precipitation falls in the week before the race.
Summary
The following stacked plots shows the weather for all 57 runnings of the Equinox marathon. The top panel shows the range of temperatures on race day from the airport station (wide bars) and estimated on Ester Dome (thin lines below bars). The shaded area at the bottom shows where temperatures are below freezing. The orange horizonal lines represent average high and low temperature in the valley (dashed lines) and on Ester Dome (solid orange lines).
The middle panel shows race day liquid precipitation (rain, melted snow). Bars marked with an asterisk indicate years where snow was also recorded at the airport, but remember that five of the other years with liquid precipitation probably experienced snow on Ester Dome (1977, 1986, 1991, 1994, and 2016) because the temperatures were likely to be below freezing at elevation.
The bottom panel shows precipitation totals from the week prior to the race. Bars marked with an asterisk indicate weeks where snow was also recorded at the airport.

Here’s a table with most of the data from the analysis.
| Date | min t | max t | ED min t | ED max t | awnd | prcp | snow | p prcp | p snow |
|---|---|---|---|---|---|---|---|---|---|
| 1963-09-21 | 32.0 | 54.0 | 27.5 | 48.2 | 0.00 | 0.0 | 0.01 | 0.0 | |
| 1964-09-19 | 34.0 | 57.9 | 29.4 | 51.8 | 0.00 | 0.0 | 0.03 | 0.0 | |
| 1965-09-25 | 37.9 | 60.1 | 33.1 | 53.9 | 0.00 | 0.0 | 0.80 | 0.0 | |
| 1966-09-24 | 36.0 | 62.1 | 31.3 | 55.8 | 0.00 | 0.0 | 0.01 | 0.0 | |
| 1967-09-23 | 35.1 | 57.9 | 30.4 | 51.8 | 0.00 | 0.0 | 0.00 | 0.0 | |
| 1968-09-21 | 23.0 | 44.1 | 19.1 | 38.9 | 0.00 | 0.0 | 0.04 | 0.0 | |
| 1969-09-20 | 35.1 | 68.0 | 30.4 | 61.3 | 0.00 | 0.0 | 0.00 | 0.0 | |
| 1970-09-19 | 24.1 | 39.9 | 20.1 | 34.9 | 0.00 | 0.0 | 0.42 | 0.0 | |
| 1971-09-18 | 35.1 | 55.9 | 30.4 | 50.0 | 0.00 | 0.0 | 0.14 | 0.0 | |
| 1972-09-23 | 19.9 | 42.1 | 16.1 | 37.0 | 0.00 | 0.0 | 0.01 | 0.2 | |
| 1973-09-22 | 30.0 | 44.1 | 25.6 | 38.9 | 0.00 | 0.0 | 0.05 | 0.0 | |
| 1974-09-21 | 48.0 | 60.1 | 42.5 | 53.9 | 0.08 | 0.0 | 0.00 | 0.0 | |
| 1975-09-20 | 37.9 | 55.9 | 33.1 | 50.0 | 0.02 | 0.0 | 0.02 | 0.0 | |
| 1976-09-18 | 34.0 | 59.0 | 29.4 | 52.9 | 0.00 | 0.0 | 0.54 | 0.0 | |
| 1977-09-24 | 36.0 | 48.9 | 31.3 | 43.4 | 0.06 | 0.0 | 0.20 | 0.0 | |
| 1978-09-23 | 30.0 | 42.1 | 25.6 | 37.0 | 0.00 | 0.0 | 0.10 | 0.3 | |
| 1979-09-22 | 35.1 | 62.1 | 30.4 | 55.8 | 0.00 | 0.0 | 0.17 | 0.0 | |
| 1980-09-20 | 30.9 | 43.0 | 26.5 | 37.8 | 0.00 | 0.0 | 0.35 | 0.0 | |
| 1981-09-19 | 37.0 | 43.0 | 32.2 | 37.8 | 0.15 | 0.0 | 0.04 | 0.0 | |
| 1982-09-18 | 42.1 | 61.0 | 37.0 | 54.8 | 0.02 | 0.0 | 0.22 | 0.0 | |
| 1983-09-17 | 39.9 | 46.9 | 34.9 | 41.5 | 0.00 | 0.0 | 0.05 | 0.0 | |
| 1984-09-22 | 28.9 | 60.1 | 24.6 | 53.9 | 5.8 | 0.00 | 0.0 | 0.08 | 0.0 |
| 1985-09-21 | 30.9 | 42.1 | 26.5 | 37.0 | 6.5 | 0.14 | 2.1 | 0.57 | 0.0 |
| 1986-09-20 | 36.0 | 52.0 | 31.3 | 46.3 | 8.3 | 0.07 | 0.0 | 0.21 | 0.0 |
| 1987-09-19 | 37.9 | 61.0 | 33.1 | 54.8 | 6.3 | 0.00 | 0.0 | 0.00 | 0.0 |
| 1988-09-24 | 37.0 | 45.0 | 32.2 | 39.7 | 4.0 | 0.00 | 0.0 | 0.11 | 0.0 |
| 1989-09-23 | 36.0 | 61.0 | 31.3 | 54.8 | 8.5 | 0.00 | 0.0 | 0.07 | 0.5 |
| 1990-09-22 | 37.9 | 50.0 | 33.1 | 44.4 | 7.8 | 0.26 | 0.0 | 0.00 | 0.0 |
| 1991-09-21 | 36.0 | 57.0 | 31.3 | 51.0 | 4.5 | 0.04 | 0.0 | 0.03 | 0.0 |
| 1992-09-19 | 24.1 | 33.1 | 20.1 | 28.5 | 6.7 | 0.01 | 0.4 | 1.26 | 23.0 |
| 1993-09-18 | 28.0 | 37.0 | 23.8 | 32.2 | 4.9 | 0.29 | 4.1 | 0.37 | 0.3 |
| 1994-09-24 | 27.0 | 51.1 | 22.8 | 45.5 | 6.0 | 0.02 | 0.0 | 0.08 | 0.0 |
| 1995-09-23 | 43.0 | 66.9 | 37.8 | 60.3 | 4.0 | 0.00 | 0.0 | 0.00 | 0.0 |
| 1996-09-21 | 28.9 | 37.9 | 24.6 | 33.1 | 6.9 | 0.06 | 1.2 | 0.26 | 0.0 |
| 1997-09-20 | 27.0 | 55.0 | 22.8 | 49.1 | 3.8 | 0.00 | 0.0 | 0.03 | 0.0 |
| 1998-09-19 | 42.1 | 60.1 | 37.0 | 53.9 | 4.9 | 0.00 | 0.0 | 0.37 | 0.0 |
| 1999-09-18 | 39.0 | 64.9 | 34.1 | 58.4 | 3.8 | 0.00 | 0.0 | 0.26 | 0.0 |
| 2000-09-16 | 28.9 | 50.0 | 24.6 | 44.4 | 5.6 | 0.00 | 0.0 | 0.30 | 0.0 |
| 2001-09-22 | 33.1 | 57.0 | 28.5 | 51.0 | 1.6 | 0.00 | 0.0 | 0.00 | 0.0 |
| 2002-09-21 | 33.1 | 48.9 | 28.5 | 43.4 | 3.8 | 0.00 | 0.0 | 0.03 | 0.0 |
| 2003-09-20 | 26.1 | 46.0 | 22.0 | 40.7 | 9.6 | 0.00 | 0.0 | 0.00 | 0.0 |
| 2004-09-18 | 26.1 | 48.0 | 22.0 | 42.5 | 4.3 | 0.00 | 0.0 | 0.25 | 0.0 |
| 2005-09-17 | 37.0 | 63.0 | 32.2 | 56.6 | 0.9 | 0.00 | 0.0 | 0.09 | 0.0 |
| 2006-09-16 | 46.0 | 64.0 | 40.7 | 57.6 | 4.3 | 0.00 | 0.0 | 0.00 | 0.0 |
| 2007-09-22 | 25.0 | 45.0 | 20.9 | 39.7 | 4.7 | 0.00 | 0.0 | 1.05 | 0.0 |
| 2008-09-20 | 34.0 | 51.1 | 29.4 | 45.5 | 4.5 | 0.00 | 0.0 | 0.08 | 0.0 |
| 2009-09-19 | 39.0 | 50.0 | 34.1 | 44.4 | 5.8 | 0.00 | 0.0 | 0.25 | 0.0 |
| 2010-09-18 | 35.1 | 64.9 | 30.4 | 58.4 | 2.5 | 0.00 | 0.0 | 0.00 | 0.0 |
| 2011-09-17 | 39.9 | 57.9 | 34.9 | 51.8 | 1.3 | 0.00 | 0.0 | 0.44 | 0.0 |
| 2012-09-22 | 46.9 | 66.9 | 41.5 | 60.3 | 6.0 | 0.00 | 0.0 | 0.33 | 0.0 |
| 2013-09-21 | 24.3 | 44.1 | 20.3 | 38.9 | 5.1 | 0.00 | 0.0 | 0.13 | 0.6 |
| 2014-09-20 | 45.0 | 51.1 | 39.7 | 45.5 | 1.6 | 0.36 | 0.0 | 0.00 | 0.0 |
| 2015-09-19 | 37.9 | 44.1 | 33.1 | 38.9 | 2.9 | 0.01 | 0.0 | 1.49 | 0.0 |
| 2016-09-17 | 34.0 | 57.9 | 29.4 | 51.8 | 2.2 | 0.01 | 0.0 | 0.61 | 0.0 |
| 2017-09-16 | 33.1 | 66.0 | 28.5 | 59.5 | 3.1 | 0.00 | 0.0 | 0.02 | 0.0 |
| 2018-09-15 | 44.1 | 60.1 | 38.9 | 53.9 | 3.8 | 0.00 | 0.0 | 0.00 | 0.0 |
| 2019-09-21 | 37.0 | 45.0 | 32.2 | 39.7 | 7.6 | 0.13 | 0.0 | 0.40 | 0.0 |