Since the middle of 2010 we’ve been monitoring the level of Goldstream Creek for the National Weather Service by measuring the distance from the top of our bridge to the surface of the water or ice. In 2012 the Creek flooded and washed the bridge downstream. We eventually raised the bridge logs back up onto the banks and resumed our measurements.
This winter the Creek had been relatively quiet, with the level hovering around eight feet below the bridge. But last Friday, we awoke to more than four feet of water over the ice, and since then it's continued to rise. This morning’s reading had the ice only 3.17 feet below the surface of the bridge.
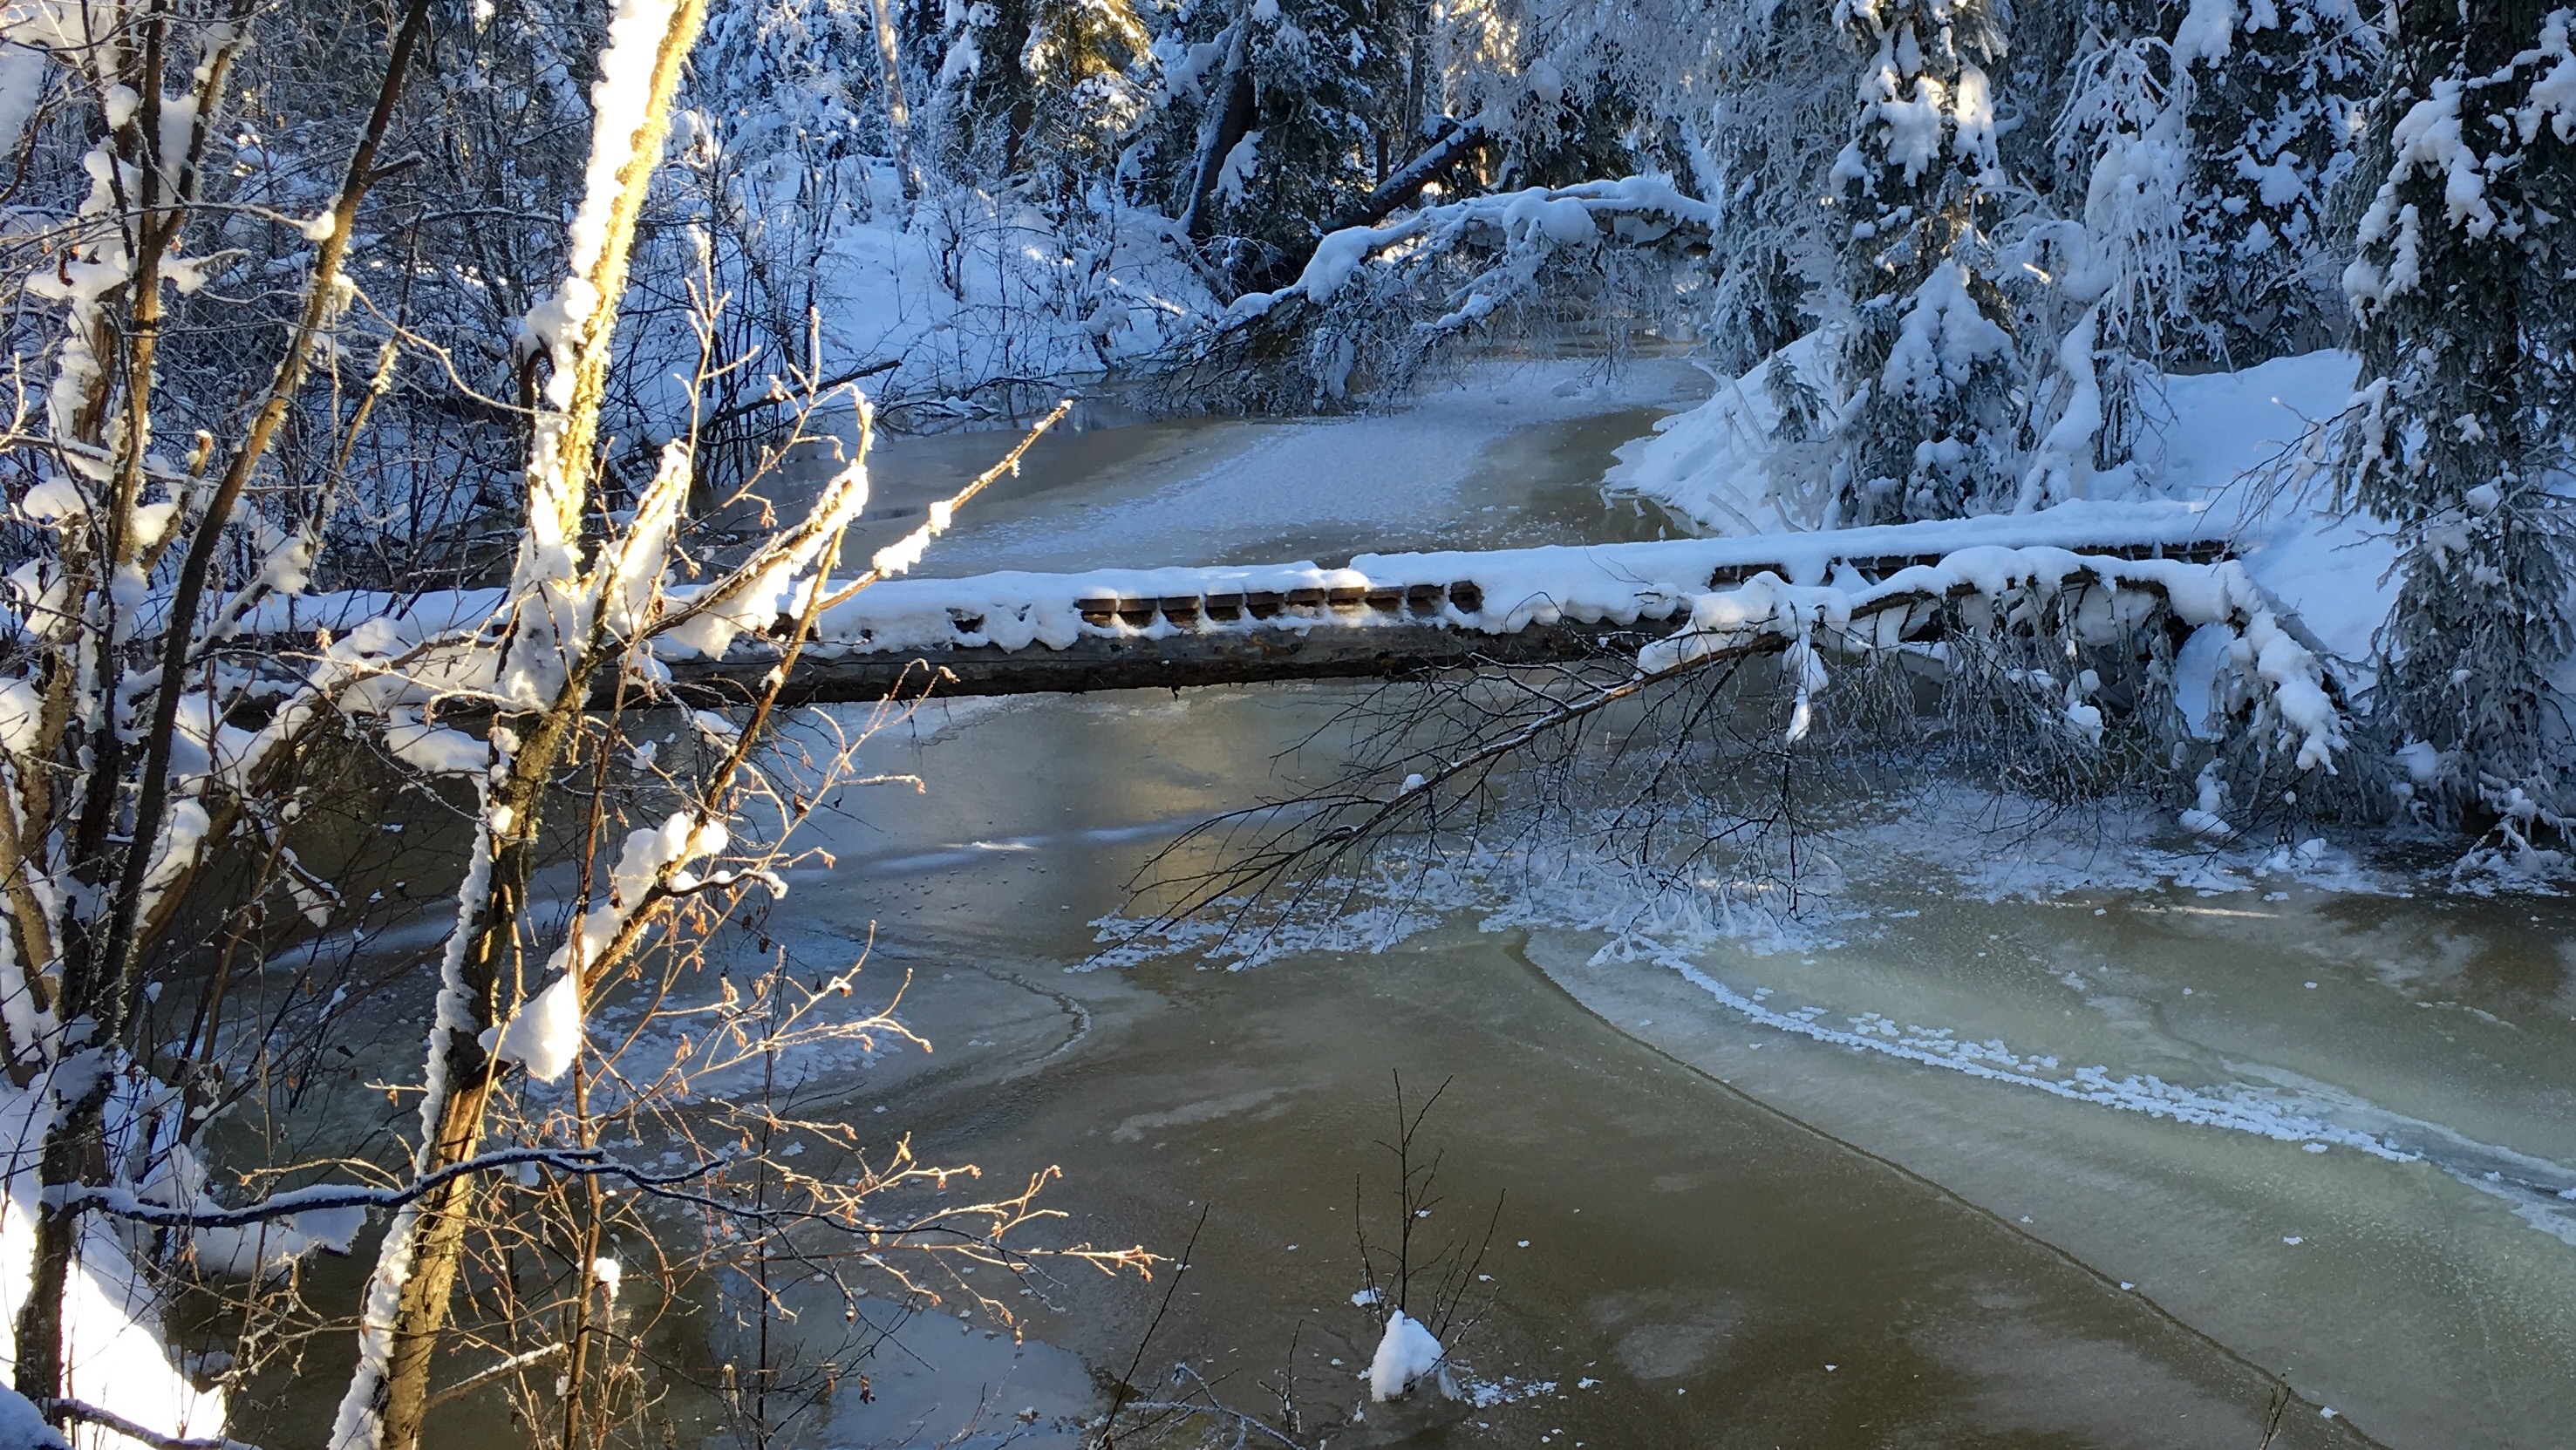
Overflow within a few feet of the bridge
Water also entered the far side of the slough, and is making it’s way around the loop, melting the snow covering the old surface. Even as the main channel stops rising and freezes, water moves closer to the dog yard from the slough.
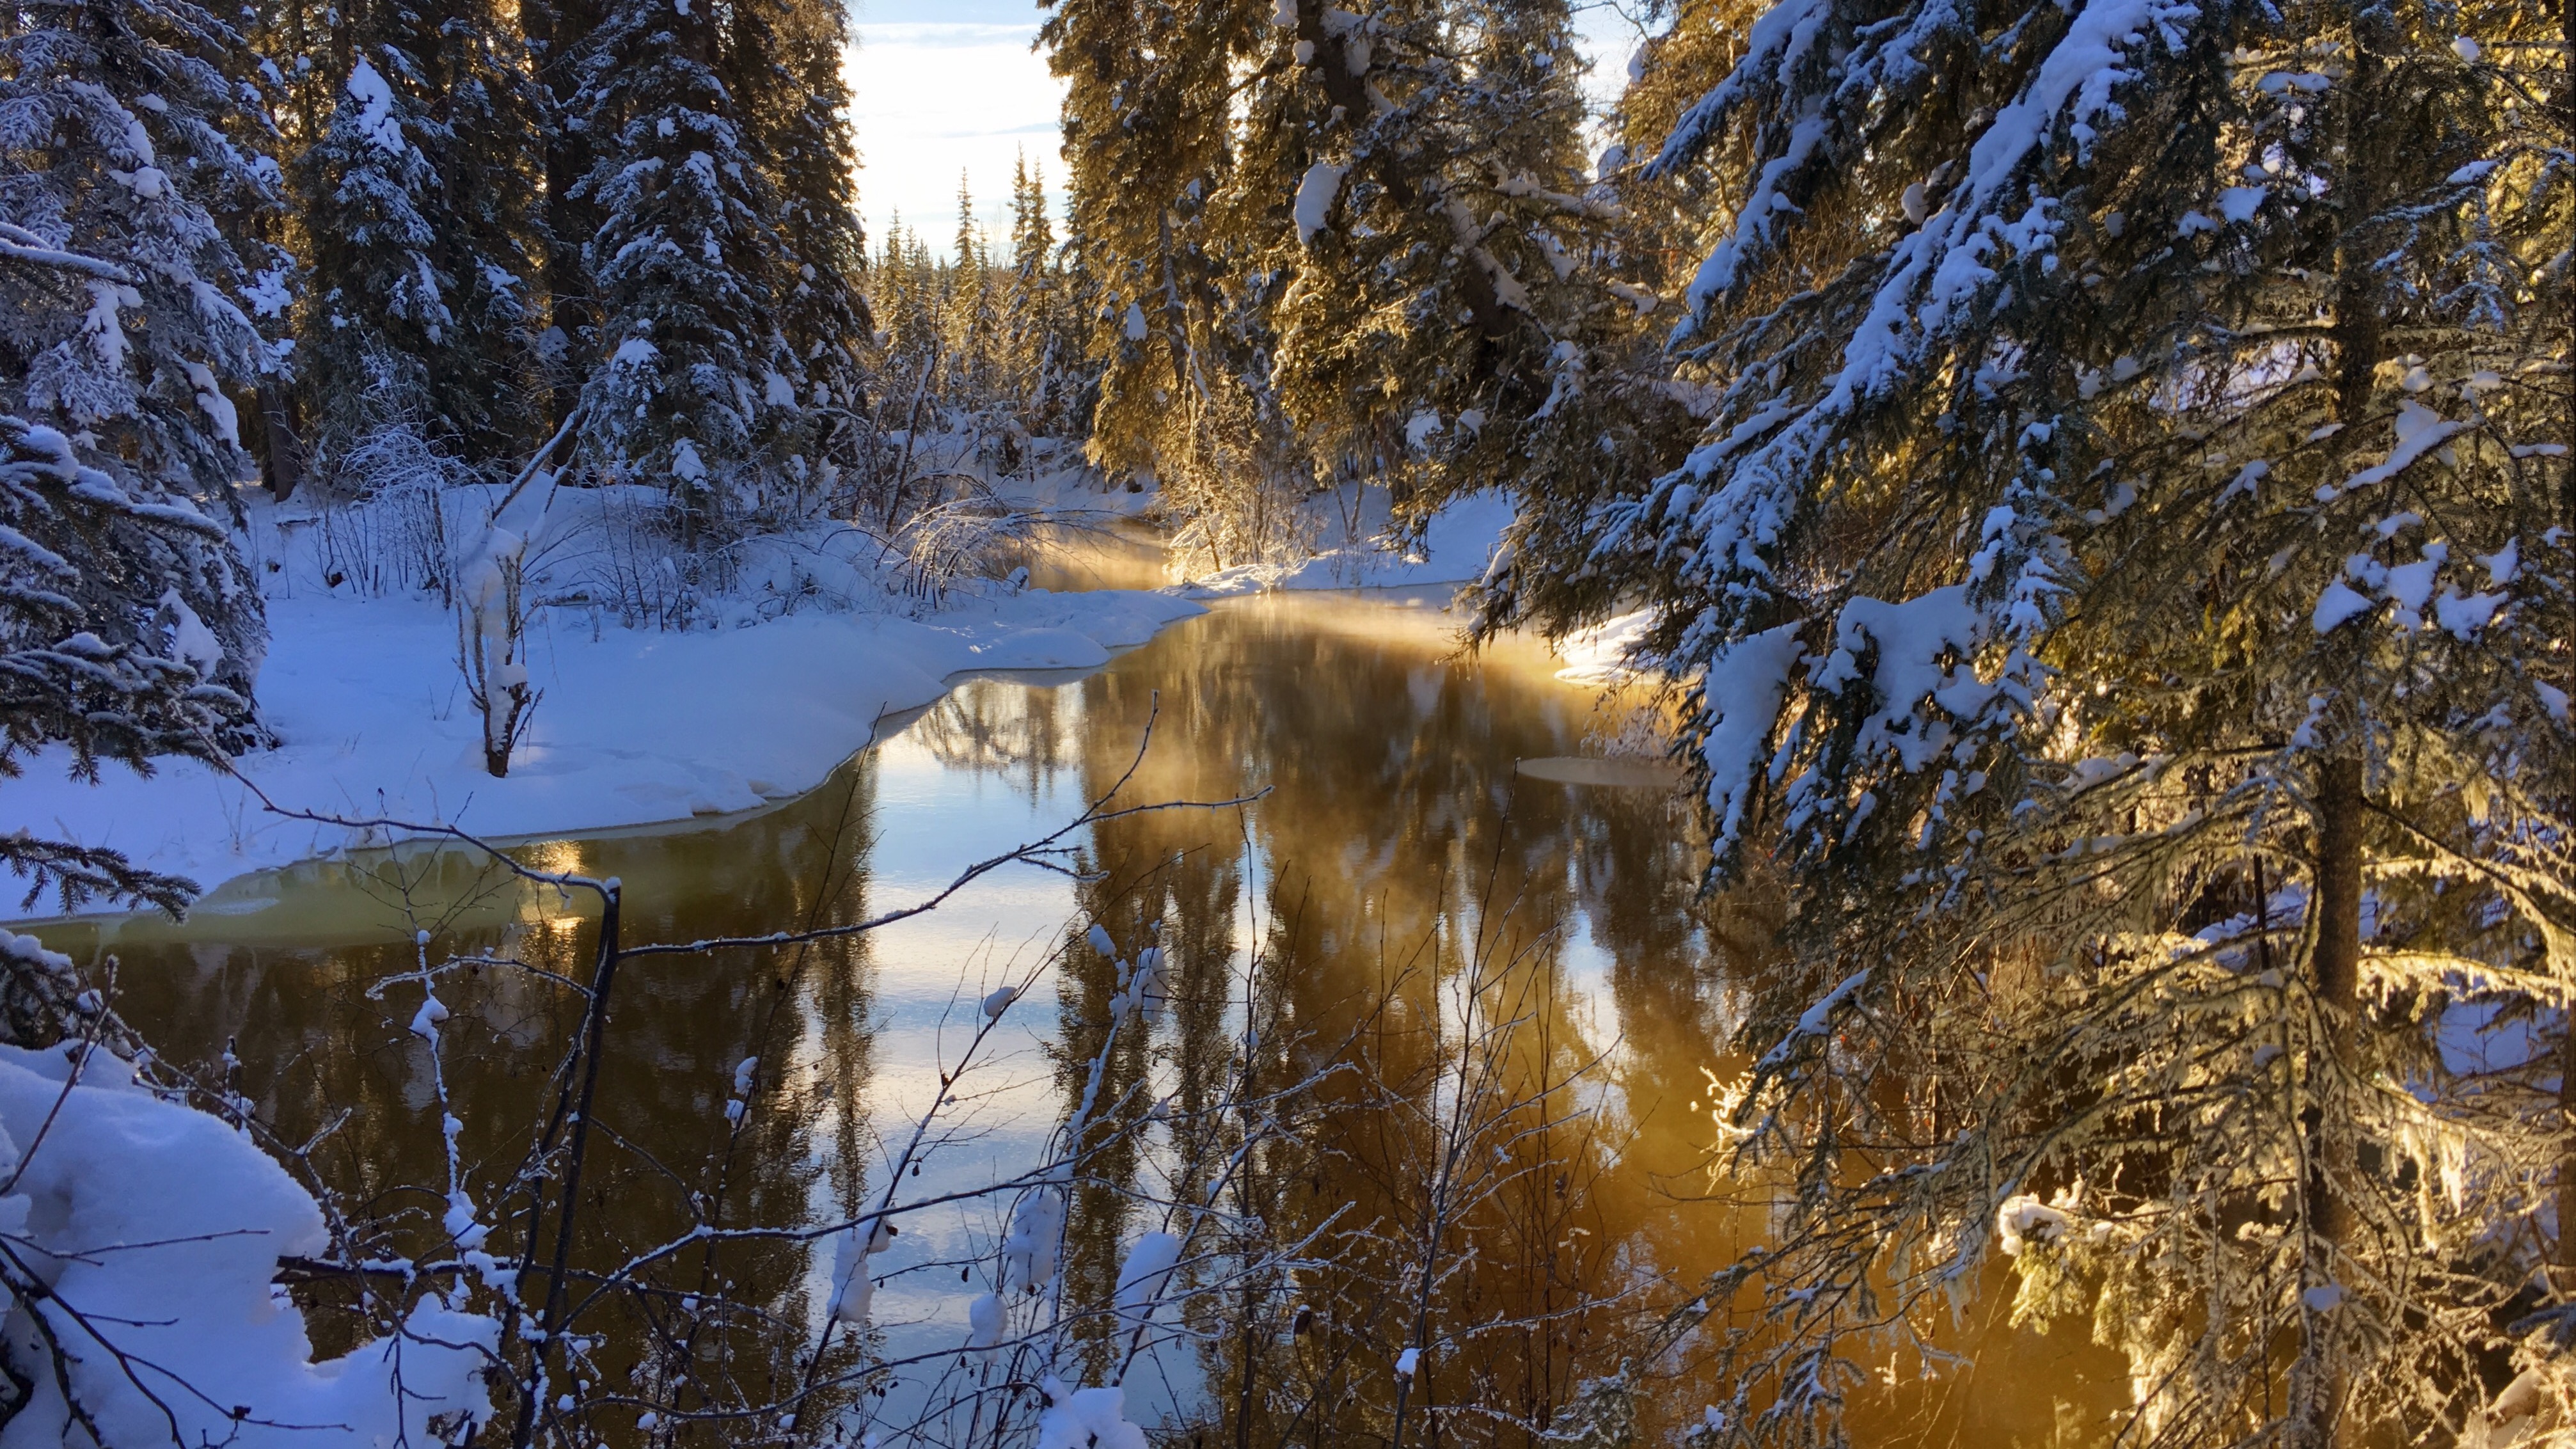
Water entering the slough
One of my longer commutes to work involves riding east on the Goldstream Valley trails, crossing the Creek by Ballaine Road, then riding back toward the house on the north side of the Creek. From there, I can cross Goldstream Creek again where the trail at the end of Miller Hill Road and the Miller Hill Extension trail meet, and ride the trails the rest of the way to work. That crossing is also covered with several feet of water and ice.
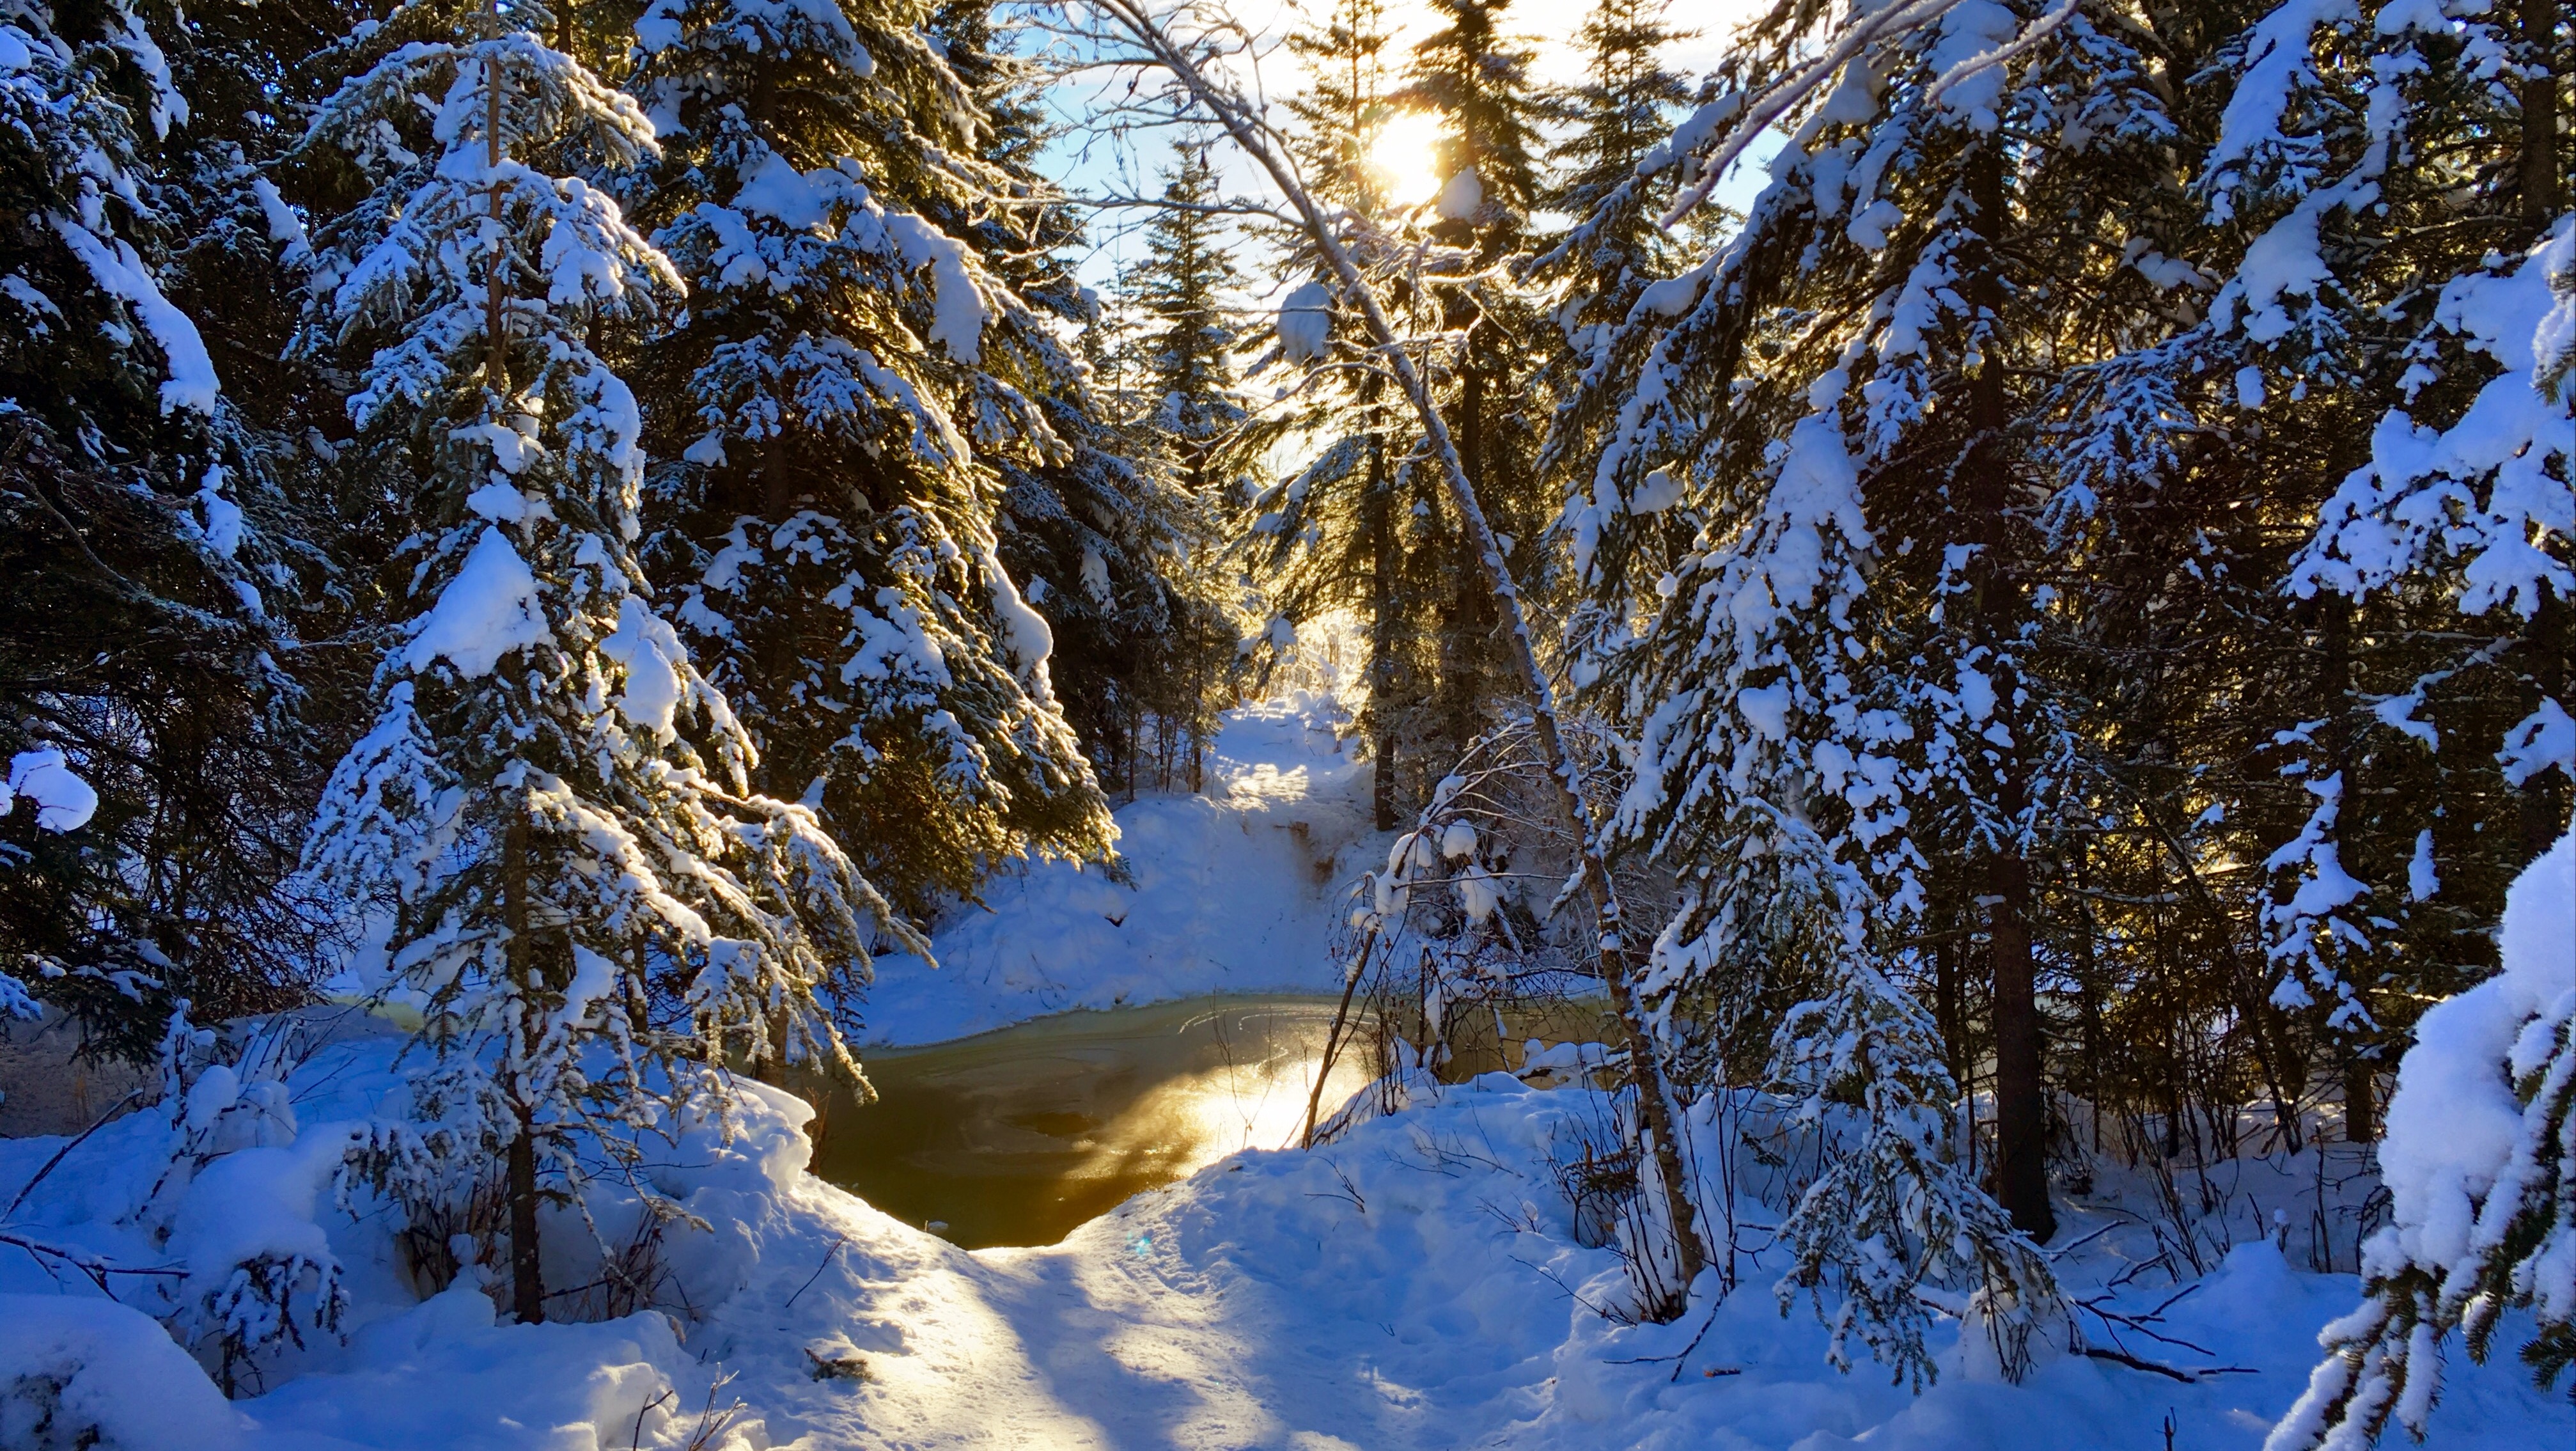
Trail crossing at the end of Miller Hill
Yesterday one of my neighbors sent email with the subject line, “Are we doomed?,” so I took a look at the heigh data from past years. The plot below shows the height of the Creek, as measured from the surface of the bridge (click on the plot to view or download a PDF, R code used to generate the plot appears at the bottom of this post).
The orange region is the region where the Creek is flowing; between my reporting of 0% ice in spring and 100% ice-covered in fall. The data gap in July 2014 was due to the flood washing the bridge downstream. Because the bridge isn’t in the same location, the height measurements before and after the flood aren’t completely comparable, but I don’t have the data for the difference in elevation between the old and new bridge locations, so this is the best we’ve got.

Creek heights by year
The light blue line across all the plots shows the current height of the Creek (3.17 feet) for all years of data. 2012 is probably the closest year to our current situation where the Creek rose to around five feet below the bridge in early January. But really nothing is completely comparable to the situation we’re in right now. Breakup won’t come for another two or three months, and in most years, the Creek rises several feet between February and breakup.
Time will tell, of course, but here’s why I’m not too worried about it. There’s another bridge crossing several miles downstream, and last Friday there was no water on the surface, and the Creek was easily ten feet below the banks. That means that there is a lot of space within the banks of the Creek downstream that can absorb the melting water as breakup happens. I also think that there is a lot of liquid water trapped beneath the ice on the surface in our neighborhood and that water is likely to slowly drain out downstream, leaving a lot of empty space below the surface ice that can accommodate further overflow as the winter progresses. In past years of walking on the Creek I’ve come across huge areas where the top layer of ice dropped as much as six feet when the water underneath drained away. I’m hoping that this happens here, with a lot of the subsurface water draining downstream.
The Creek is always reminding us of how little we really understand what’s going on and how even a small amount of flowing water can become a huge force when that water accumulates more rapidly than the Creek can handle it. Never a dull moment!
Code
library(readr)
library(dplyr)
library(tidyr)
library(lubridate)
library(ggplot2)
library(scales)

wxcoder <- read_csv("data/wxcoder.csv", na=c("-9999"))
feb_2016_incomplete <- read_csv("data/2016_02_incomplete.csv",
                                na=c("-9999"))

wxcoder <- rbind(wxcoder, feb_2016_incomplete)

wxcoder <- wxcoder %>%
   transmute(dte=as.Date(ymd(DATE)), tmin_f=TN, tmax_f=TX, tobs_f=TA,
             tavg_f=(tmin_f+tmax_f)/2.0,
             prcp_in=ifelse(PP=='T', 0.005, as.numeric(PP)),
             snow_in=ifelse(SF=='T', 0.05, as.numeric(SF)),
             snwd_in=SD, below_bridge_ft=HG,
             ice_cover_pct=IC)

creek <- wxcoder %>% filter(dte>as.Date(ymd("2010-05-27")))

creek_w_year <- creek %>%
   mutate(year=year(dte),
         doy=yday(dte))

ice_free_date <- creek_w_year %>%
   group_by(year) %>%
   filter(ice_cover_pct==0) %>%
   summarize(ice_free_dte=min(dte), ice_free_doy=min(doy))

ice_covered_date <- creek_w_year %>%
   group_by(year) %>%
   filter(ice_cover_pct==100, doy>182) %>%
   summarize(ice_covered_dte=min(dte), ice_covered_doy=min(doy))

flowing_creek_dates <- ice_free_date %>%
   inner_join(ice_covered_date, by="year") %>%
   mutate(ymin=Inf, ymax=-Inf)

latest_obs <- creek_w_year %>%
   mutate(rank=rank(desc(dte))) %>%
   filter(rank==1)

current_height_df <- data.frame(
      year=c(2011, 2012, 2013, 2014, 2015, 2016),
      below_bridge_ft=latest_obs$below_bridge_ft)

q <- ggplot(data=creek_w_year %>% filter(year>2010),
            aes(x=doy, y=below_bridge_ft)) +
   theme_bw() +
   geom_rect(data=flowing_creek_dates %>% filter(year>2010),
             aes(xmin=ice_free_doy, xmax=ice_covered_doy, ymin=ymin, ymax=ymax),
             fill="darkorange", alpha=0.4,
             inherit.aes=FALSE) +
   # geom_point(size=0.5) +
   geom_line() +
   geom_hline(data=current_height_df,
              aes(yintercept=below_bridge_ft),
              colour="darkcyan", alpha=0.4) +
   scale_x_continuous(name="",
                      breaks=c(1,32,60,91,
                               121,152,182,213,
                               244,274,305,335,
                               365),
                      labels=c("Jan", "Feb", "Mar", "Apr",
                               "May", "Jun", "Jul", "Aug",
                               "Sep", "Oct", "Nov", "Dec",
                               "Jan")) +
   scale_y_reverse(name="Creek height, feet below bridge",
                   breaks=pretty_breaks(n=5)) +
   facet_wrap(~ year, ncol=1)

width <- 16
height <- 16
rescale <- 0.75
pdf("creek_heights_2010-2016_by_year.pdf",
    width=width*rescale, height=height*rescale)
print(q)
dev.off()
svg("creek_heights_2010-2016_by_year.svg",
    width=width*rescale, height=height*rescale)
print(q)
dev.off()

back cabin during the flood
The summer of 2014 will be remembered by most Fairbanksans as the rainiest summer in memory, but for those living on Goldstream Creek, it marks the first time in at least 30 years that the Creek went over the banks. It started with completely saturated ground from near-continuous rain in late June and was followed by more than three inches of rain falling during a single 24-hour period on July 1st and 2nd.
By the evening of the 2nd, the Creek had risen to the banks, washed out our 18-year old log bridge, and eventually flooded our property to a depth requiring chest waders to make it out to the back cabin. It crested in the early morning hours of July 3rd, and took the entire day to return to the confines of the Creek bed.
Here are a few videos of the flooding, including one showing our bridge washing downstream in front of the back cabin.
Since the flood receded, we cleaned up the mess, repaired the foundation under the arctic entryway, and worked to raise the bridge and lift the back cabin higher off the ground so it is no longer in danger of being flooded in the next event.
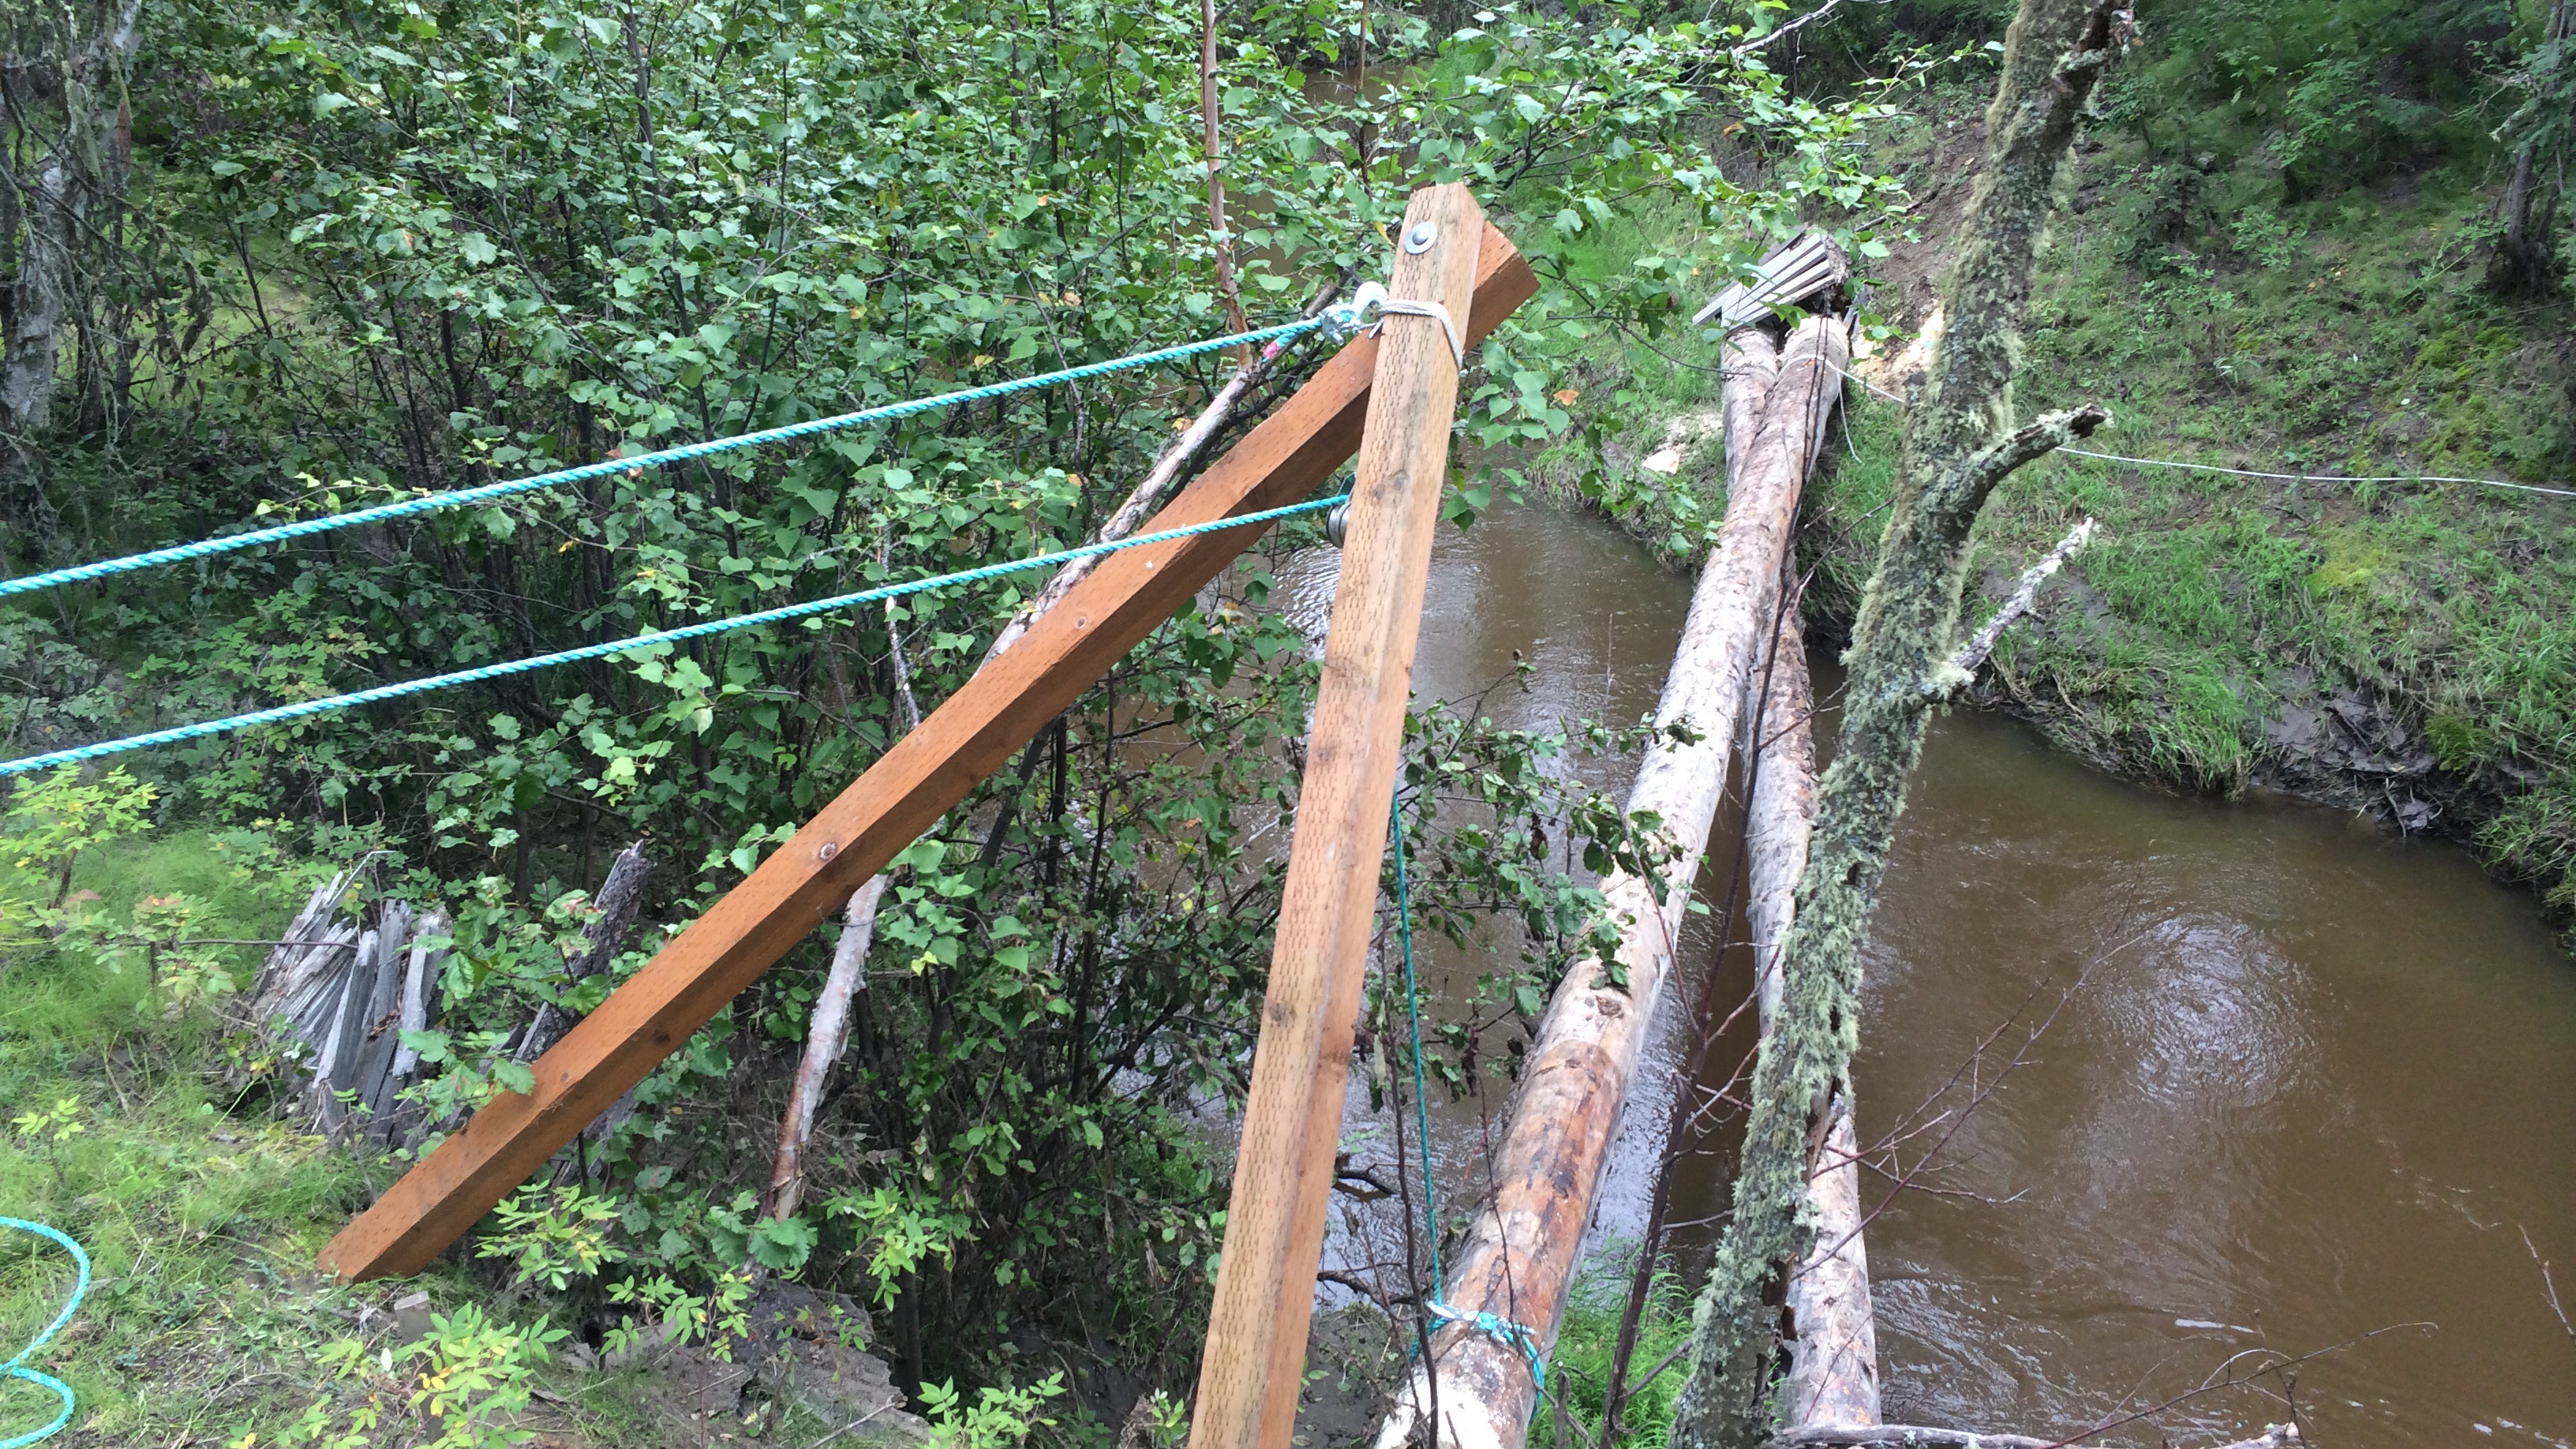
Raising the logs back up to the banks was an exercise in how to carefully lift and move very heavy things without an overhead crane. The technique is based on a pair of 4x4’s bolted together at the top to form an arch. The bipod sits on the bank and leans over the edge, with one rope winch keeping the bipod from falling into the Creek and another rope winch attached to the log through a pulley hanging from the top of the bipod. For it to work, there needs to be a greater than 90° angle at the pulley so that the action of tightening the rope connected to the load will pull the top of the bipod down (but instead, lifts the end of the log). Here’s a photo taken during the first lift.
The cabin was lifted using a pair of “railroad jacks” on the ends of the bottom side logs. Amazingly, the entire cabin could be picked up from the very ends of the logs, and in two days we had the cabin up ten or eleven inches sitting on large pressure-treated pads.
Earlier this week we had another unprecedented rainstorm that dumped more than two inches of rain in less than 24 hours, breaking the daily record, and giving Fairbanks more than our average monthly rainfall for September in a single day. The following graph (PDF version) shows the water level in the Creek following the storm.
It took just over 24 hours for the flood to Crest, and then another three days to come back down to the level it was before the storm. We observed a similar pattern in the July flooding event, but I can’t seem to find the notebook where I recorded the heights (and then depths once it was over the banks). It is quite remarkable how quickly the water rises once it begins; when we got home from work on July 2nd and the water was only a third of the way across the dog yard, I still thought the water would be contained. But it continued rising and rising. It will be interesting to compare the pattern from July to September if I can find those numbers. Having a sense of what we can expect from the Creek when we get a big rainstorm is very valuable information.