Over the last three days we’ve gotten 0.92 inches of rain at our house (0.40, 0.39 and 0.13 each day). The airport got 0.79 inches (0.03, 0.51, 0.25). The daily differences are due to the different times that the daily totals are reported (midnight at the airport, 6 AM at our house). I thought it would be interesting to look at how many days each year we experience rainfall greater than a particular amount. For example, in an average year, on how many days would we expect to get more than 0.4 inches of rain?
Methods
We’ll retrieve precipitation and snowfall data from the Airport, and exclude any day where there was measurable snowfall. Precipitation data includes measuring melted snowfall, and we’re only interested in rain events, so we discard any precipitation value that could be partially snow. The data comes from the Global Historical Climatology Network daily (GHCNd) data set, and we are retrieving data for the Fairbanks, Anchorage, Juneau, Portland (Oregon), and Rochester (New York) airports, as well as the Davis California experimental farm for the full extent of their record. We remove the data for the earliest and latest year because they are likely to be incomplete.
After filtering the data to contain only rain, we’ll write a function to count the number of days in each year where the rainfall was greater than or equal to the value passed in as an argument. Then summarize those yearly values into the mean, median, maximum, and 5th and 95th percentiles. Of those statistics, median and maximum are the most useful. Because these are counts (days where an event occurs) the middle value (median) is a better estimator than the average (mean), which will be biased in a skewed distribution.
Finally, we select a series of rainfall amounts from 0 to 4 inches of rain in a day, and run the function for each of these values. We also created a subset of the data since 1990 to see if the pattern of rain has changed more recently.
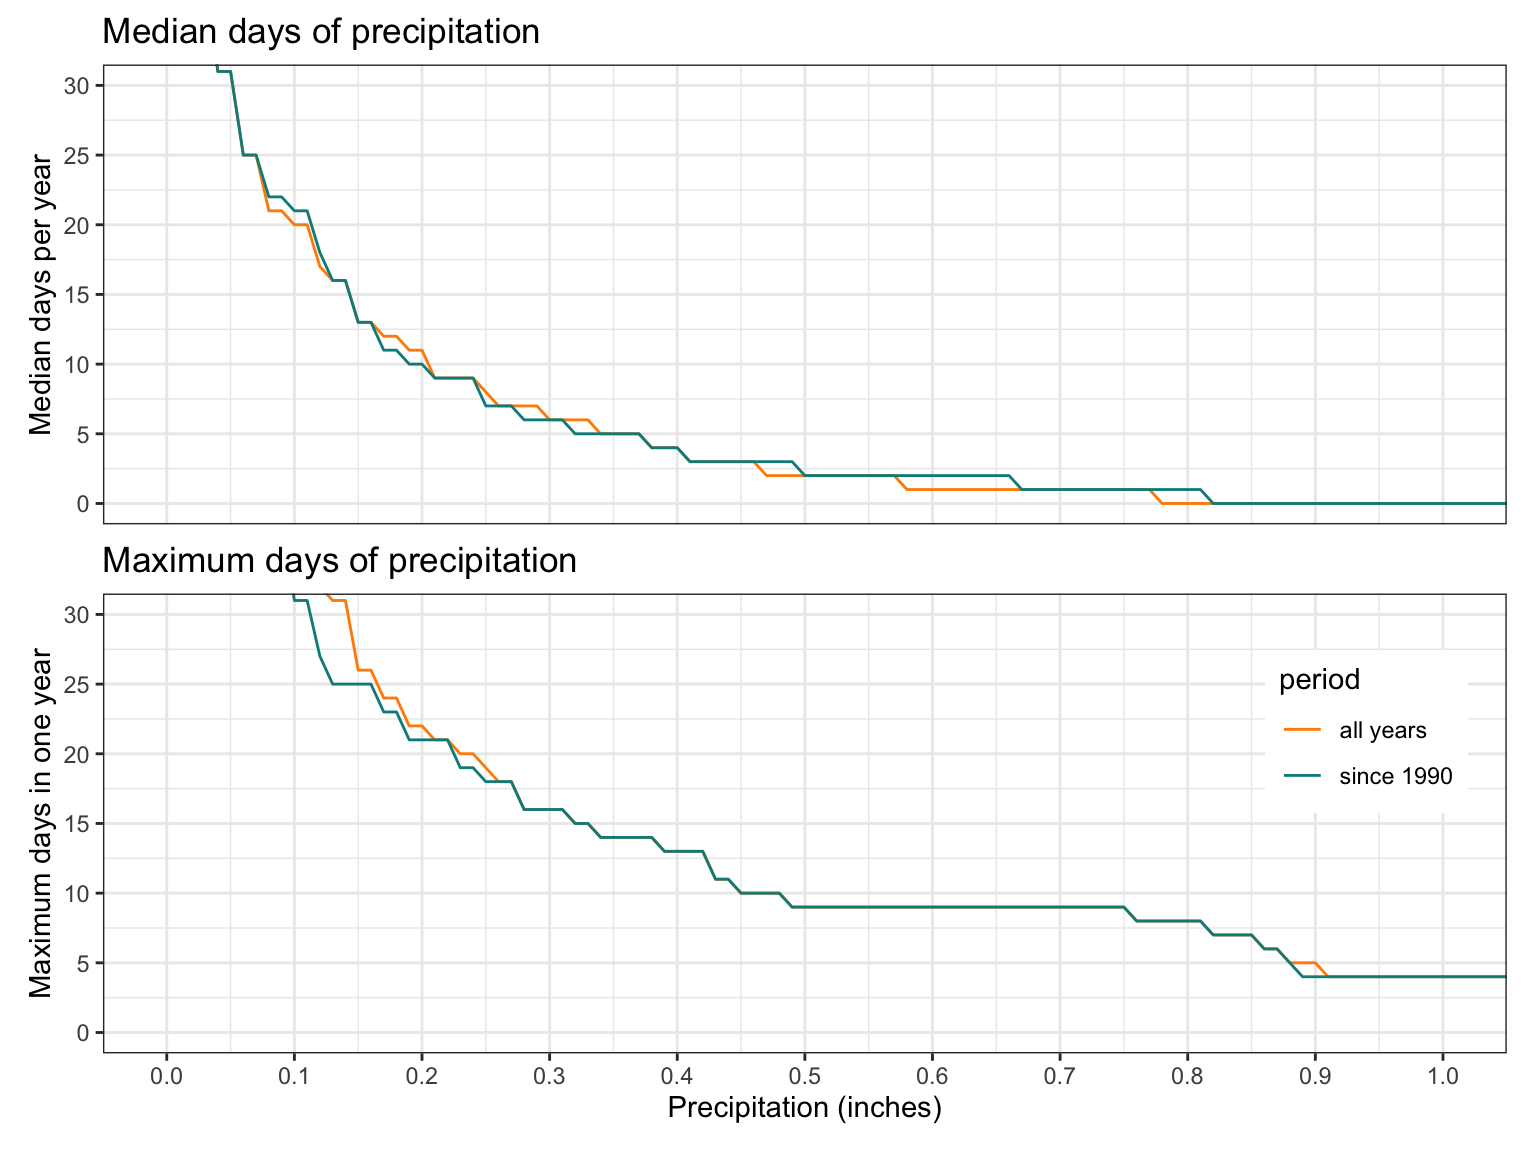
Here’s a pair of plots showing the median (top plot) and maximum (bottom) number of days per year (the y-axis) for various rainfall amounts (the x-axis). The full record (1930‒2023) for the Fairbanks station is shown in orange, and the data from 1990 to 2023 is shown in dark cyan.
Code
median_plot <-ggplot(data = all_recent |>filter(station_name =="FAIRBANKS INTL AP"),aes(x = prcp_level, y = median, color = period),alpha =0.75) +geom_line() +coord_cartesian(xlim =c(0, 1), ylim =c(0, 30)) +theme_bw() +scale_x_continuous(name ="Precipitation (inches)",breaks =pretty_breaks(n =10) ) +scale_y_continuous(name ="Median days per year",breaks =pretty_breaks(n =10) ) +scale_color_manual(values =c("darkorange", "darkcyan") ) +theme(legend.position ="none",axis.title.x =element_blank(),axis.text.x =element_blank(),axis.ticks.x =element_blank(),plot.margin =margin(1, 1, 0, 1, "pt") ) +labs(title ="Median days of precipitation")max_plot <-ggplot(data = all_recent |>filter(station_name =="FAIRBANKS INTL AP"),aes(x = prcp_level, y = max, color = period),alpha =0.75) +geom_line() +coord_cartesian(xlim =c(0, 1), ylim =c(0, 30)) +theme_bw() +scale_x_continuous(name ="Precipitation (inches)",breaks =pretty_breaks(n =10) ) +scale_y_continuous(name ="Maximum days in one year",breaks =pretty_breaks(n =10) ) +scale_color_manual(values =c("darkorange", "darkcyan") ) +theme(legend.position ="inside",legend.position.inside =c(0.9, 0.7) ) +labs(title ="Maximum days of precipitation")median_plot / max_plot
From this plot, you can see that getting 0.4 inches of rain in one day happens about 4 times in an average year and that at least once, Fairbanks got 0.4 inches or more on 13 days in a single year.
There isn’t much of a difference between the two curves except a slight uptick in the number of days with heavier rainfall events. The dark cyan line (more recent data) looks like it’s slightly ahead of the orange line for rain above 0.45 inches. These patterns would probably be more pronounced if the graph were to compare pre- and post-1990 data instead of comparing all years against the last 33 years.
Alaska
What about the precipitation data from other locations in the state? Here’s a set of median plots for Fairbanks, Anchorage, and Juneau.
It’s a bit rainier in Anchorage than Fairbanks, but not by as much as I would have expected. Juneau, on the other hand, is off the charts rainy with more than 30 days in the year with more than half an inch of rain. The change in precipitation in the last 30 years is also quite pronounced in both Anchorage (lower precipitation compared with the full record) and Juneau (higher precipitation).
Outside
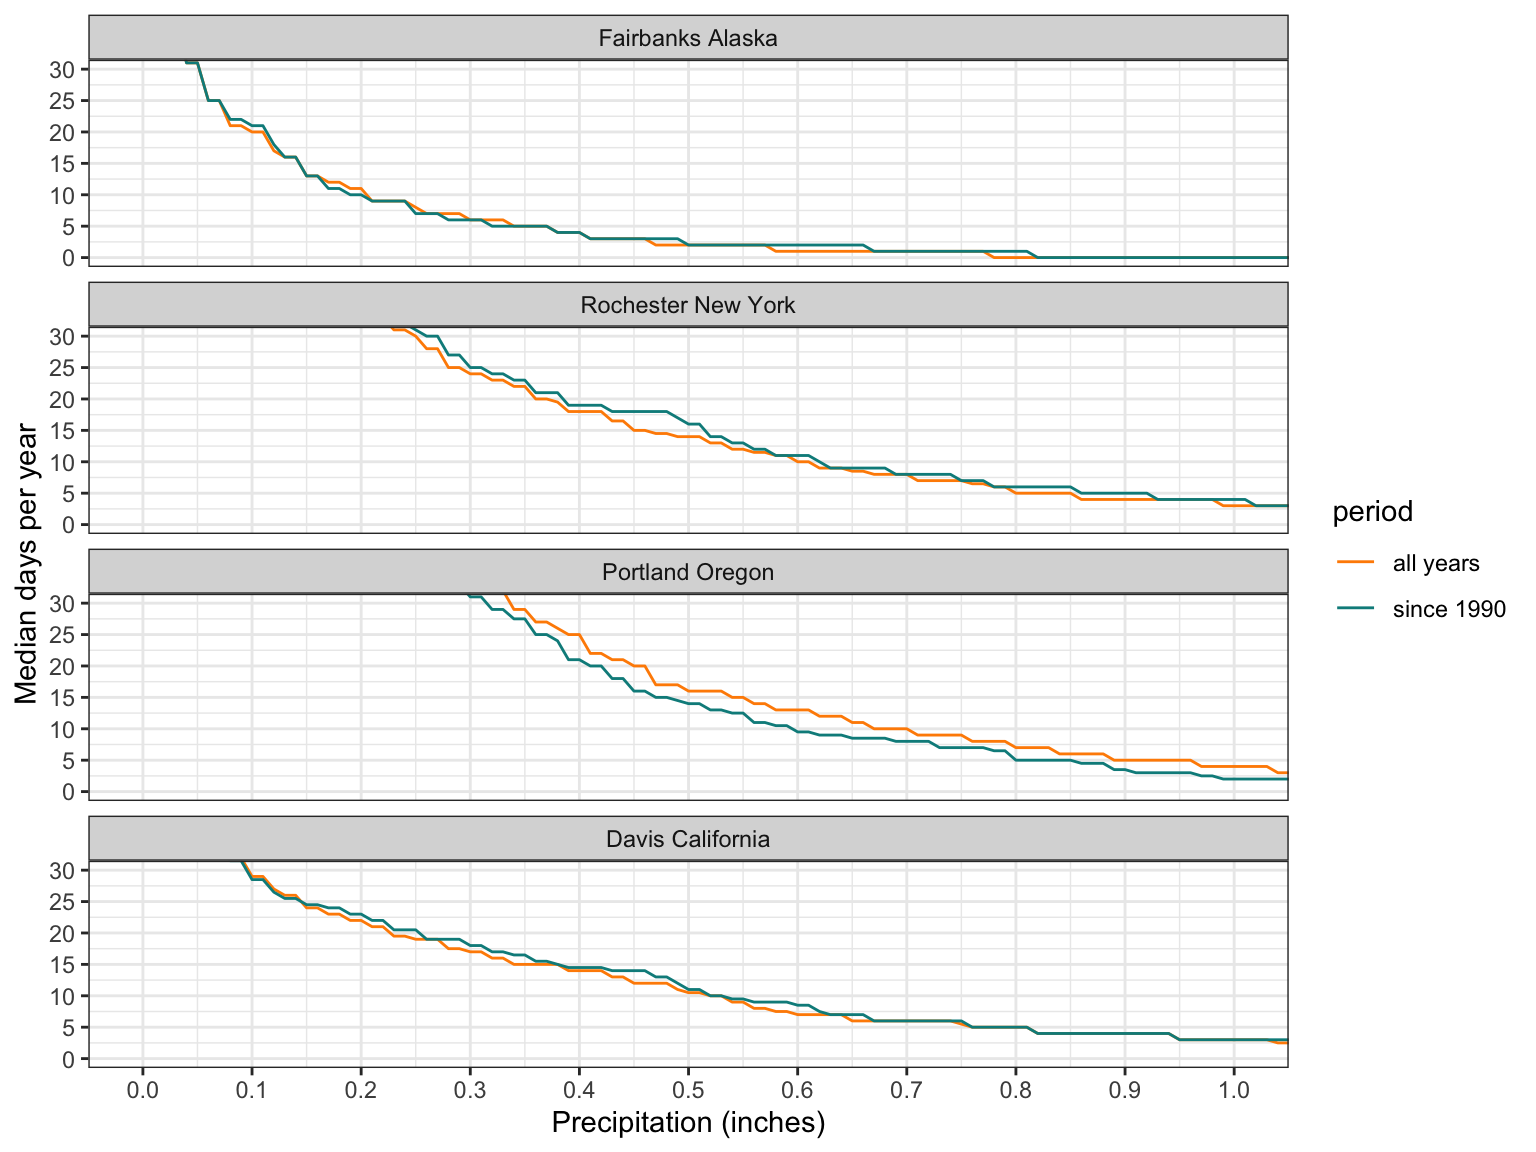
Finally, Portland, Rochester, and Davis California.
Rochester and Portland are similar to each other, with around 15 days with more than half an inch of rain per year, but opposite patterns recently, with Rochester experiencing slightly higher rainfall and slightly lower in Portland. Having lived in Davis for three years, I’m surprised at how rainy it actually is, with 10 days a year with more than half an inch of rain.