Yesterday I attempted to watch the A’s Opening Day game against the Mariners in the Oakland Coliseum. Unfortunately, it turns out the entire state of Alaska is within the blackout region for all Seattle Mariners games, regardless of where the Mariners are playing.
The A’s lost the game, so maybe I’m not too disappointed I didn’t see it, but for curiousity, let’s extend Major League Baseball’s Alaska blackout “logic” to the rest of the country and see what that looks like.
First, load in the locations of all Major League stadiums into a PostGIS database. There are a variety of sources for this on the Internet, but many are missing the more recent stadiums. I downloaded one and updated those that weren’t correct using information on Wikipedia.
CREATE TABLE stadiums (
   division text, opened integer, longitude numeric,
   latitude numeric, class text, team text,
   stadium text, league text, capacity integer
);
COPY stadiums FROM 'stadium_data.csv' CSV HEADER;
Turn the latitude and longitudes into geographic objects:
SELECT addgeometrycolumn('stadiums', 'geom_wgs84', 4326, 'POINT', 2);
CREATE SEQUENCE stadium_id_seq;
ALTER TABLE stadiums
   ADD COLUMN id integer default (nextval('stadium_id_seq'));
UPDATE stadiums
   SET geom_wgs84 = ST_SetSRID(
      ST_MakePoint(longitude, latitude), 4326
   );
Now load in a states polygon layer (which came from: http://www.arcgis.com/home/item.html?id=f7f805eb65eb4ab787a0a3e1116ca7e5):
$ shp2pgsql -s 4269 states.shp | psql -d stadiums
Calculate how far the farthest location in Alaska is to Safeco Field:
SELECT ST_MaxDistance(safeco, alaska) / 1609.344 AS miles
FROM (
   SELECT ST_Transform(geom_wgs84, 3338) AS safeco
   FROM stadiums WHERE stadium ~* 'safeco'
) AS foo, (
   SELECT ST_Transform(geom, 3338) AS alaska
   FROM states
   WHERE state_name ~* 'alaska'
) AS bar;

miles
------------------
 2467.67499410842
Yep. Folks in Alaska are supposed to travel 2,468 miles (3,971,338 meters, to be exact) in order to attend a game at Safeco Field (or farther if they’re playing elsewhere because the blackout rules aren’t just for home games anymore).
Now we add a 2,468 mile buffer around each of the 30 Major League stadiums to see what the blackout rules would look like if the rule for Alaska was applied everywhere:
SELECT addgeometrycolumn(
   'stadiums', 'ak_rules_buffer', 3338, 'POLYGON', 2);
UPDATE stadiums
SET ak_rules_buffer =
   ST_Buffer(ST_Transform(geom_wgs84, 3338), 3971338);
Here's a map showing what these buffers look like:
Or, shown another way, here’s the number of teams that would be blacked out for everyone in each state. Keep in mind that there are 30 teams in Major League Baseball so the states on the top of the list shouldn’t be able to watch any team if Alaska rules were applied evenly to the country:
| Blacked out teams | States |
|---|---|
| 30 | Alabama, Arkansas, Colorado, Illinois, Indiana, Iowa, Kansas, Kentucky, Louisiana, Michigan, Minnesota, Mississippi, Missouri, Nebraska, New Mexico, North Dakota, Ohio, Oklahoma, South Dakota, Tennessee, Texas, Utah, Wisconsin, Wyoming |
| 29 | Idaho, Montana, Arizona |
| 28 | District of Columbia, West Virginia |
| 27 | Georgia, South Carolina |
| 26 | Nevada |
| 25 | Pennsylvania, Florida, Vermont |
| 24 | Rhode Island, New Hampshire, Connecticut, Delaware, New Jersey, New York, North Carolina, Virginia, Maryland, Massachusetts |
| 23 | Maine |
| 22 | Oregon, Washington, California |
| 1 | Alaska |
| 0 | Hawaii |
Based on this, Hawaii would be the place to live as they can actually watch all 30 teams! Except the blackout rules for Hawaii are even stupider than Alaska: they can’t watch any of the teams on the West Coast. Ouch!
This is stupid-crazy. It seems to me that a more appropriate rule might be buffers that represent a two hour drive, or whatever distance is considered “reasonable” for traveling to attend a game. When I lived in Davis California we drove to the Bay Area several times a season to watch the A’s or Giants play, and that’s about the farthest I’d expect someone to go in order to see a three hour baseball game.
This makes a much more reasonable map:
I’m sure there are other issues going on here, such as cable television deals and other sources of revenue that MLB is trying to protect. But for the fans, those who ultimately pay for this game, the current situation is idiotic. I don’t have access to cable television (and even if I did, I won’t buy it until it’s possible to pick and choose which stations I want to pay for), and I’m more than 2,000 miles from the nearest ballpark. My only avenue for enjoying the game is to pay MLB $130 for a MLB.TV subscription. Which I happily do. Unfortunately, this year I can’t watch my teams whenever they happen to play the Mariners.

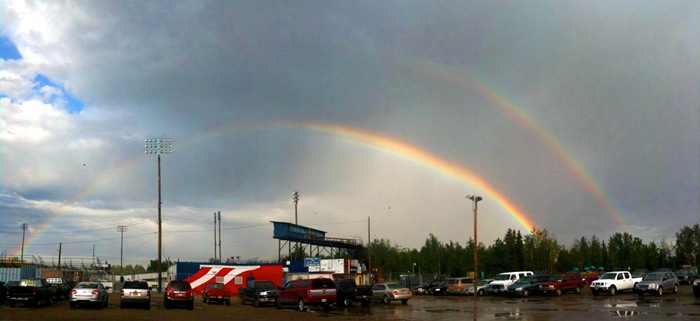
Alaska Goldpanners, rainbow
Andrea and I went to see the Alaska Goldpanners again last night. As we were leaving the house, it started to lightly drizzle, and after the first inning of play, it started raining at the ballpark. We didn’t wind up staying for the whole game (the Goldpanners won 8—3): we left after our pitcher threw two wild pitches over the catcher to score two Anchorage Bucs runs because he couldn’t get a good grip on the wet ball.
For more than an inning, there was a spectacular triple rainbow. One of the great things about baseball: you never know what you're going to see, on and off the field!
If you’re in Fairbanks this summer, you owe it to yourself to come out to the ballpark at least once. It’s a cheap evening, is often a more interesting game than the brand of baseball you see in the Major Leagues, it’s great to be outside watching the next generation of baseball players, and the Goldpanners could really use the support. They had to drop out of the Alaska Baseball League this summer, and are playing an abbreviated season, but hopefully if they get enough fan support, they’ll play a full season next year. The link in the first paragraph takes you to the schedule.
I hope to see you at the ballpark!
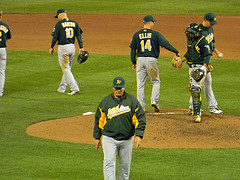
Bob Geren photo from rburtzel
Yesterday A’s closer Brian Fuentes said some unfortunate things about his manager (Bob Geren) in frustration over when he was sent out to pitch in relief yesterday. Here’s what A’s closer (2005—2008) Huston Street had to say about his former manager today:
My least favorite person I have ever encountered in sports from age 6 to 27.
Think about that for a minute. Ever encountered!? To quote my nephew, “Daaaang!” How can the A’s keep Geren around when he’s clearly despised by the players he’s managing?
June 9, 2011, Update: Geren fired! Bob Melvin hired as Interim Manager.

Tim Lincecum and the Giants
Yesterday was opening day in Major League Baseball. Yahoo!
I watched bits of Tigers v. Yankees, Padres v. Cardinals, and much of the Giants v. Dodgers game, all on my iPhone. I haven’t subscribed to MLB.tv, but yesterday’s games were sponsored by Volvo, so anyone with the MLB 11 app could watch for free. The quality is reasonable, and the app seems smart about not consuming all the available bandwidth.
I root for the A’s, Giants and Phillies (and favor the Tigers and Cubs when there are no other rooting interests). All three are pretty good teams, and all of them have the starting pitching to contend, but may have trouble scoring runs. The A’s have no power threat and a cadre of fragile, replacement-level position players, the Giants need a good season from Posey, Sandoval and rookie Brandon Belt, and the Phillies are hurting without Werth and Utley. But however it turns out, it’s great to have baseball back.
Well, however it turns out as long as the Yankees, Angels, Braves and Dodgers don’t wind up in the World Series…
I recently saw a pair of blog posts showing how to make heatmaps with straight R and with ggplot2. Basketball doesn’t really interest me, so I figured I’d attempt to do the same thing for the 2010 Oakland Athletics 40-man roster. Results are at the bottom of the post.
First, I needed to get the 40-man roster:
$ w3m -dump "http://oakland.athletics.mlb.com/team/roster_40man.jsp?c_id=oak" > 40man
Then trim it down so it’s just a listing of the player’s names.
Next, get the baseball data bank (BDB) database from http://baseball-databank.org/, convert and insert it into a PostgreSQL database using mysql2pgsql.perl.
A Python script reads the names from the roster, and dumps a CSV file of the batting and pitching data for the past two seasons for the players passed in.
$ cat 40man_names | ./get_two-year_batter_stats.py
The batting data looks like this:
            name  , age,   g,    ba,   obp,   slg,   ops,  rc,   hrr,    kr,   bbr
Daric Barton (1B) ,  25, 194, 0.238, 0.342, 0.365, 0.707,  73, 0.017, 0.173, 0.134
Travis Buck (RF)  ,  27,  74, 0.223, 0.289, 0.392, 0.682,  28, 0.035, 0.202, 0.073
Chris Carter (LF) ,  28,  13, 0.261, 0.320, 0.261, 0.581,   1, 0.000, 0.360, 0.080
...
I’ve used the counting stats in the BDB to calculate batting average (ba), on-base percentage (obp), slugging percentage (slg), OPS (on-base percentage + slugging percentage), runs created (rc), home run rate (hrr), strikeout rate (kr) and walks rate (bbr).
And the pitching data:
            name   , age,  g,      ip,  w, l,    sv,    wp,    lp,    wf,   era,    k9,   bb9,   hr9
Brett Anderson (P) ,  22,  30, 175.33, 11,  11,   0,  0.37,  0.37,  0.00,  4.06,  7.70,  2.36,  1.03
Andrew Bailey (P)  ,  26,  68,  83.33,  6,   3,  26,  0.09,  0.04,  0.04,  1.84,  9.83,  2.92,  0.54
Jerry Blevins (P)  ,  27,  56,  60.00,  1,   3,   0,  0.02,  0.05, -0.04,  3.75,  8.70,  3.30,  0.60
...
Here I’ve calculated innings pitched (ip), winning percentage (wp), losing percentage (lp), win frequency (wf), earned run average (era), strikeouts per nine innings (k9), walks per nine (bb9), and home runs given up per nine innings (hr9). All these stats are for the last two Major League seasons.
Finally, generate the heat maps in R. For batting statistics:
library(ggplot2)
mlb <- read.csv('batting.csv')
mlb$name <- with(mlb, reorder(name, ops))
mlb.m <- melt(mlb)
mlb.m <- ddply(mlb.m, .(variable), transform, rescale = rescale(value))
(p <- ggplot(mlb.m, aes(variable, name)) +
+   geom_tile(aes(fill = rescale), colour = "white") +
+   scale_fill_gradient(low = "gold", high = "darkgreen"))
base_size <- 14
p + theme_grey(base_size = base_size) + labs(x = "", y = "") +
+   scale_x_discrete(expand = c(0, 0)) + scale_y_discrete(expand = c(0, 0)) +
+   opts(legend.position = "none", axis.ticks = theme_blank(),
+   axis.text.x = theme_text(size = base_size * 0.8, angle = 0, hjust = 0.5, colour = "black"),
+   axis.text.y = theme_text(size = base_size * 0.8, lineheight = 0.9, colour="black", hjust = 1))
Pitching statistics are the same, except the third line (where I order the data frame) is:
mlb$name <- with(mlb, reorder(name, 1/(era+0.1)))
The results:
A’s batting heatmap, ordered by OPS

A’s pitching heatmap, ordered by ERA

You have to keep the number of games (or innings pitched for pitchers) in mind when you look at these charts. I don’t even know who some of those guys are, probably because they’ve only barely played in the majors. It might make some sense to split the pitching plot into plots for starters and relievers, but I’d need a good way to determine a pitcher’s status (innings pitched divided by games beyond some threshold, perhaps?).
As for the A’s, I like their pitching, but have serious doubts about their offense. I sure hope some of the younger guys on this chart start reaching their power potential because having Jack Cust as your only offensive weapon doesn’t bode well for the team scoring runs.