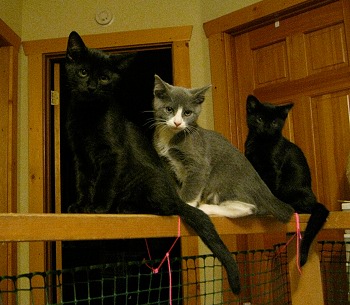
We finally agreed on some names for our kittens: Tallys is the small black kitten, Jenson is gray and white and Caslon is the larger of the two black boys. They’re all serif fonts, as Andrea says, “because they’ve got tails!” We struggled for a long time with different naming schemes, but both of us really liked Tallys and Jenson as names, and once we’d gotten those two it was just a question of finding a third font that was appropriate. Caslon is one of my favorite fonts (it’s the typeface used for the body text in The New Yorker), and I think it fits well with the other two.
The kittens are still living in the bedroom but this weekend I fenced in the area at the top of the stairs and came up with a setup that should allow us to leave the bedroom door open and give them a little more room. This way we can slowly expand their range upstairs by opening the doors to the other rooms before letting them downstairs. There’s always a chance they will figure a way around my cat-catchers, or that they’ll jump off the balcony railing, but so far we’re only letting them out when we’re home so we can keep an eye out. The biggest problem with this plan is that the dogs can see the kittens at the top of the stairs and as a result, they’re staring and whining at them. Hopefully this behavior will stop in the near future.
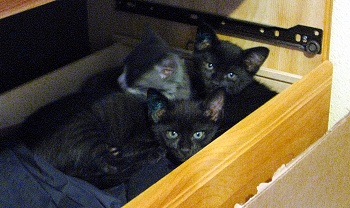
In the last day or two the kittens have gotten more snuggly in between bursts of activity. Last night all three slept with us; one up next to Andrea and the other two between us on the bed. Then, after this morning’s playtime I laid down on the bed to watch This Old House and all three kittens came up and crashed all over me. Gray-white and Black-black were zonked but little Gray-black was still playful and kept jumping between snoozing kittens trying to entice a battle. Eventually all three (Java, Python, and C?) dropped to sleep and I managed to get the photo on the right.
Monitoring dog-kitten interactions at night is still keeping us from getting a good night’s sleep, but I think we’re making gradual progress. Nika has made her peace with the situation and just tries to stay out of the way. Piper is very playful and interested in as much interaction as they’ll let her, but she still moves too fast and they’re not letting her get very close. I think it will take time for the kittens to relax and realize that Piper is just curious.
The video was shot a couple days ago, and it’s nothing more than a trio of kittens warping all over the bedroom for almost four minutes. My main intent was to capture my favorite ninja kitten move: when two charge straight at each other, and just before colliding they jump straight up in the air and start battling as they fall back to the ground. I think I got at least one airborne wresting match in this video (at around 1:28).
We’re making progress integrating the kittens into our lives. They’re still living in our bedroom and are getting more comfortable with their surroundings. Last night we had Piper and Nika sleep in the room with us, and things went as well as could be expected. The kittens slept until around 3 AM, and the bravest of the bunch (black-black) came out and asserted his position to Piper. Piper did really well, but after about a half an hour of kitty spitting, hissing and swatting, we decided to give both species a break and I went downstairs and slept on the couch with the dogs. Nika doesn’t appear to want anything to do with the little guys, and Piper’s interest appears to be simple curiosity. We haven’t seen any aggressive behaviors or chasing, but so far the interactions have been pretty minimal.
We haven’t come up with any names yet, so we’re calling them by their colorations. The top photo shows “black-black” and “gray-white,” and the third kitten is “gray-black.” Andrea asked her Facebook friends for names and we’ve gotten a lot of suggestions. My favorite so far is Sam, Merry and Pippin, but even that combination doesn’t seem quite right. Andrea came up with Ash, Soot and Coal, which would be perfect for their colorations, but I’m not crazy about naming a cat after a fossil fuel. Font names are also a possibility, but no one would know what they mean. Characters from The Wire and names based on sports teams have been briefly considered. Part of the problem is that we’re friends with a lot of dog mushers, and that means that almost any name or naming scheme has been used and is associated with a dog or litter. If there wasn’t an Alaskan plant litter in Bonnie’s yard, those would have been great names (Ledum, Salix, etc.). So we’re still working on it.
Black-black is very brave and was the first one out to challenge Piper (and attack her wagging tail), followed by gray-white. The two of them spend most of their play time chasing each other around the room, battling. Gray-black is quite a bit thinner than the other two and is very skittish even with his brothers. He’s also the best climber, and is the only one who has shown any interest in snuggling with us. We’ve gotten all three to purr, but while they’re awake, they seem much more interested in racing around, jumping about, and climbing all over everything than cuddling with us.
They like to sleep in the bottom drawer of an armoire in the corner (photo left). When they first came into the room, they managed to squeeze under the decorative trim on the bottom of the cabinet (my last post showed grey-white coming out from there), and from there climbed up the backs of the drawers. We eventually removed the second drawer because it was hard to know in which drawer you might find a kitten, and we were afraid of accidentally injuring one opening the drawers. The open space also allows them to get in without going underneath, something they won’t be able to do much longer.

Oh hai!
After more than two years, we are finally cat owners again. A veterinarian friend of ours knew someone fostering a pregnant cat for the local animal shelter, and after a few visits with Mom and the kittens, eight weeks, and a major hassle with the shelter, we got three male kittens. There are two black kittens and one grey and white one. They’re hanging out in the bedroom while we work on re-introducing all the dogs to cats (and the kittens to dogs).
We haven’t come up with names yet, mostly because we were afraid to name animals that the shelter might have given to someone else. We’d like to come up with a naming scheme (Soot, Ash, and Coal were one set under consideration; Taiga, Tundra, and some unidentified Alaska ecotype were another), but nothing has really hit the mark.
Expect many, many blog posts with sickeningly cute kitten photos.

Escape from under the dresser

Snow on the road
We got 2 inches of snow yesterday (October 26th), so the wait is finally over.
I made the mistake of riding my bicycle to work yesterday, as the snow was falling. It wasn’t too bad on my way in to work, but by the time I left, more than an inch of snow had fallen and the roads hadn’t been plowed. I do have studded, knobby tires on my bicycle, but they’re don’t work very well in situations where the snow is deeper than the tread. I managed to stay upright the whole way home, but it was some white-knuckle, one-wheel drive bicycling.
Note: Yesterday’s first real snowfall was the 8th latest in the 62 year historical record I have access to for the Fairbanks airport station. I'm not sure where the statistics reported in Tuesday’s newspaper came from.


