In a post last week I examined how often Fairbanks gets more than two inches of snow in late spring. We only got 1.1 inches on April 24th, so that event didn’t qualify, but another snowstorm hit Fairbanks this week. Enough that I skied to work a couple days ago (April 30th) and could have skied this morning too.
Another, probably more relevant statistic would be to look at storm totals rather than the amount of snow that fell within a single, somewhat arbitrary 24-hour period (midnight to midnight for the Fairbanks Airport station, 6 AM to 6 AM for my COOP station). With SQL window functions we can examine the totals over a moving window, in this case five days and see what the largest late season snowfall totals were in the historical record.
Here’s a list of the late spring (after April 21st) snowfall totals for Fairbanks where the five day snowfall was greater than three inches:
| Storm start | Five day snowfall (inches) |
|---|---|
| 1916-05-03 | 3.6 |
| 1918-04-26 | 5.1 |
| 1918-05-15 | 2.5 |
| 1923-05-03 | 3.0 |
| 1937-04-24 | 3.6 |
| 1941-04-22 | 8.1 |
| 1948-04-26 | 4.0 |
| 1952-05-05 | 3.0 |
| 1964-05-13 | 4.7 |
| 1982-04-30 | 3.1 |
| 1992-05-12 | 12.3 |
| 2001-05-04 | 6.4 |
| 2002-04-25 | 6.7 |
| 2008-04-30 | 4.3 |
| 2013-04-29 | 3.6 |
Anyone who was here in 1992 remembers that “summer,” with more than a foot of snow in mid May, and two feet of snow in a pair of storms starting on September 11th, 1992. I don’t expect that all the late spring cold weather and snow we’re experiencing this year will necessarily translate into a short summer like 1992, but we should keep the possibility in mind.
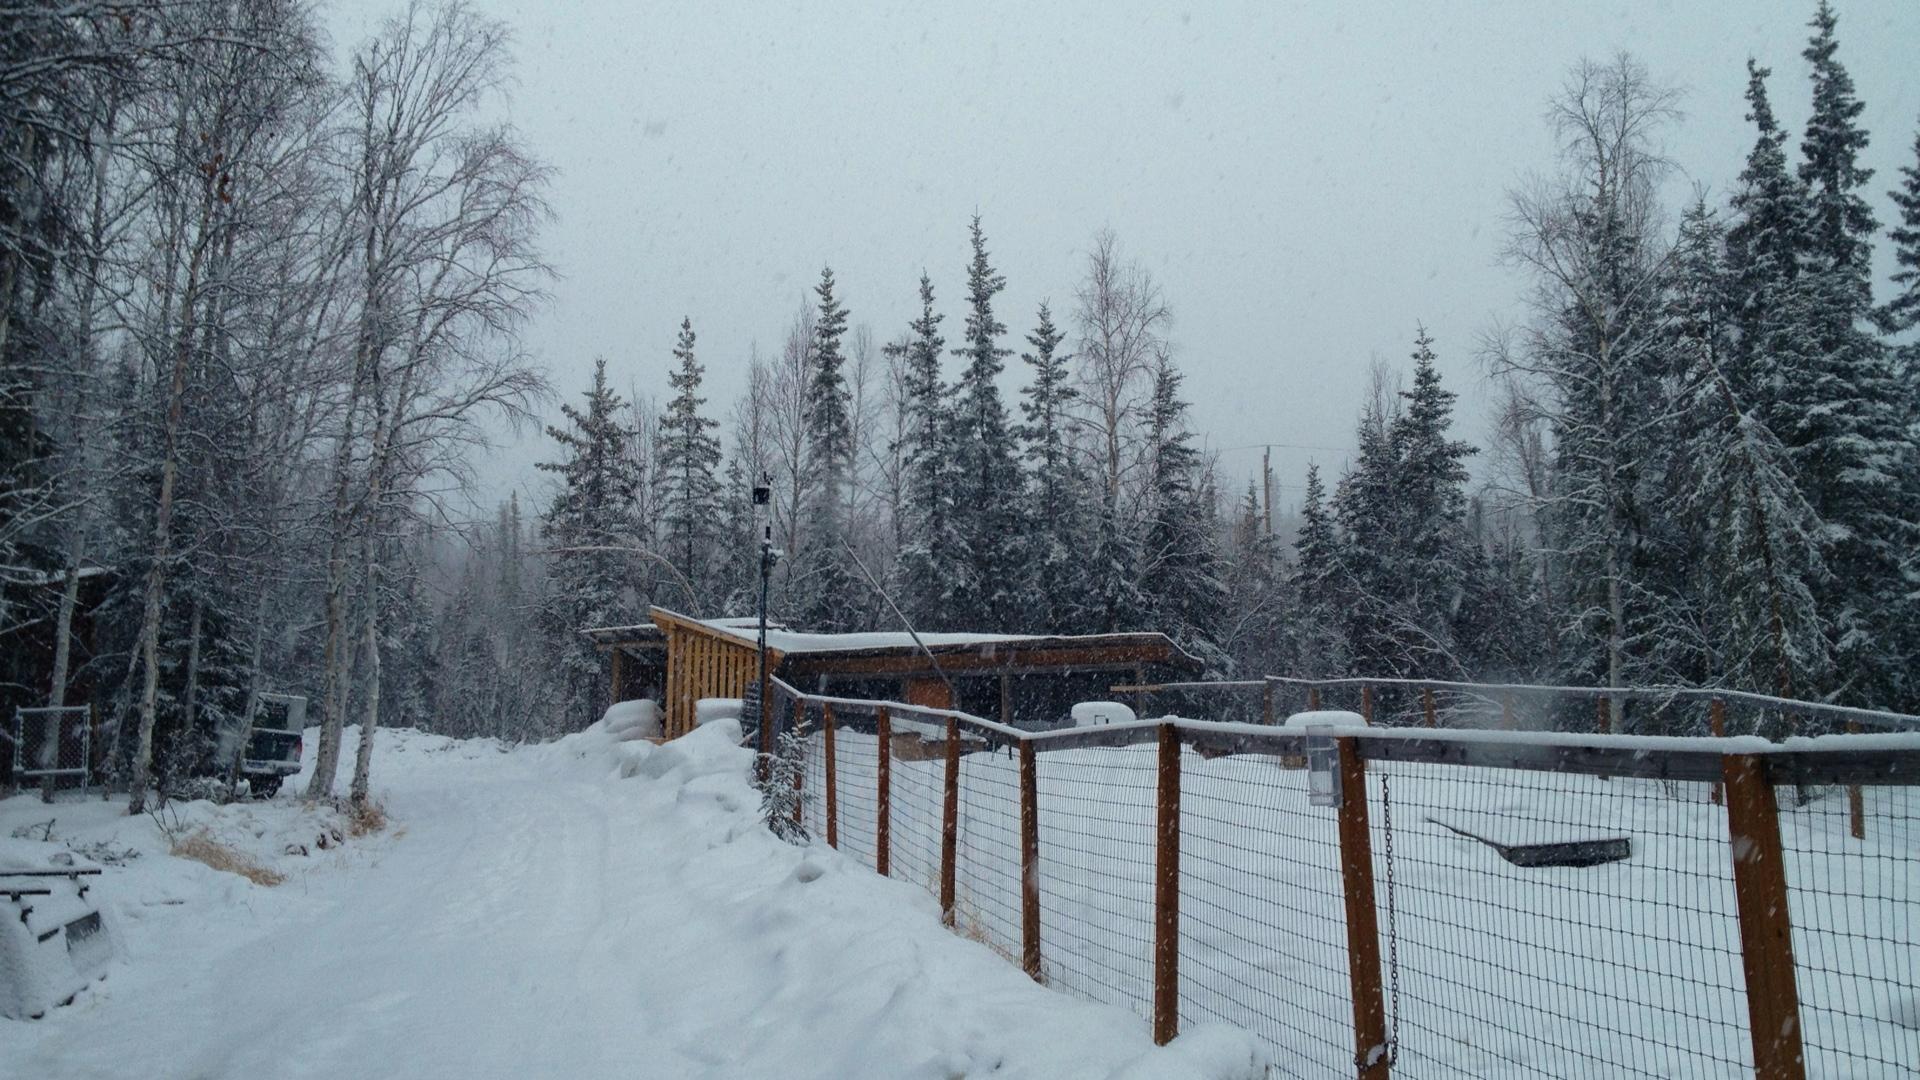
I’m writing this blog post on May 1st, looking outside as the snow continues to fall. We’ve gotten three inches in the last day and a half, and I even skied to work yesterday. It’s still winter here in Fairbanks.
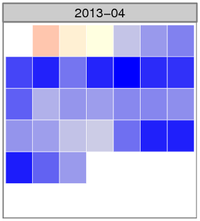
The image shows the normalized temperature anomaly calendar heatmap for April. The bluer the squares are, the colder that day was compared with the 30-year climate normal daily temperature for Fairbanks. There were several days where the temperature was more than three standard deviations colder than the mean anomaly (zero), something that happens very infrequently.
Here are the top ten coldest average April temperatures for the Fairbanks Airport Station.
| Rank | Year | Average temp (°F) | Rank | Year | Average temp (°F) |
|---|---|---|---|---|---|
| 1 | 1924 | 14.8 | 6 | 1972 | 20.8 |
| 2 | 1911 | 17.4 | 7 | 1955 | 21.6 |
| 3 | 2013 | 18.2 | 8 | 1910 | 22.9 |
| 4 | 1927 | 19.5 | 9 | 1948 | 23.2 |
| 5 | 1985 | 20.7 | 10 | 2002 | 23.2 |
The averages come from the Global Historical Climate Network - Daily data set, with some fairly dubious additions to extend the Fairbanks record back before the 1956 start of the current station. Here’s the query to get the historical data:
SELECT rank() OVER (ORDER BY tavg) AS rank,
       year, round(c_to_f(tavg), 1) AS tavg
FROM (
    SELECT year, avg(tavg) AS tavg
    FROM (
        SELECT extract(year from dte) AS year,
               dte, (tmin + tmax) / 2.0 AS tavg
        FROM (
            SELECT dte,
                   sum(CASE WHEN variable = 'TMIN'
                            THEN raw_value * 0.1
                            ELSE 0 END) AS tmin,
                   sum(CASE WHEN variable = 'TMAX'
                            THEN raw_value * 0.1
                            ELSE 0 END) AS tmax
            FROM ghcnd_obs
            WHERE variable IN ('TMIN', 'TMAX')
                  AND station_id = 'USW00026411'
                  AND extract(month from dte) = 4 GROUP BY dte
        ) AS foo
    ) AS bar GROUP BY year
) AS foobie
ORDER BY rank;
And the way I calculated the average temperature for this April. pafg is a text file that includes the data from each day’s National Weather Service Daily Climate Summary. Average daily temperature is in column 9.
$ tail -n 30 pafg | \
  awk 'BEGIN {sum = 0; n = 0}; {n = n + 1; sum += $9} END { print sum / n; }'
18.1667