| Device | Watts |
| Time capsule | 12 |
| MacBook Pro | 26 |
| Linux server | 20 |
| Refrigerator | 42 |
| 46" LCD TV | 50 |
| Arctic entryway ventilation fan | 50 |
| Circulating pump | 62 |
| Boot driers | 71 |
| Sewage treatment plant | 350 |
| Jeep heaters | 640 |
| Dakota heaters | 650 |
| Water pump | 1,240 |
| Bedroom heater | 1,500 |
A little over a year ago we bought a whole house energy monitor (The Energy Detective (T.E.D)). It’s got a pair of clamping ammeters that measure the current going through the main power leads inside the breaker panel in our house. This information is transmitted to a small console that we’ve got in the living room, as well as a unit that is connected to our wireless router and displays a web page with the data. I wrote a script that reads this data every minute and stores it in a database. It can also send the data to Google Power if you’re not interested in storing the data yourself.
The console that comes with it runs on rechargeable batteries charged by the cradle it sits in. That means that you can take the console with you to see how much electricity various devices in the house consume. You just watch the display, turn on whatever it is you want to measure, and within a second or two, you can see the wattage increase on the display. We’ve measured the power that the major devices around our house consume, shown in the table on the right.
The lights aren’t in the table. Much of the downstairs is lit with R40 bulbs in ceiling cans, in which we’ve placed 23 Watt CFLs. The most common lighting pattern in the winter is to have the four lights in the kitchen and the single can above the couch on, which is just under 100 Watts. We also have six motion sensing lights, four in the dog yard and one on the shed. Four of these are CFL bulbs (around 20 Watts), and two are outdoor floods (70 Watts). When the dogs are outside in the dark, we’re typically using around 180 Watts to light the dog yard, and the motion sensors also consume some energy even when the bulbs aren’t lit.
Of the devices in the table, we’re always running the sewage treatment plant, the time capsule and the Linux server (around 380 Watts). In winter the circulating pump is running all the time keeping the water and septic lines thawed and we use lights and various other heaters quite a bit more.
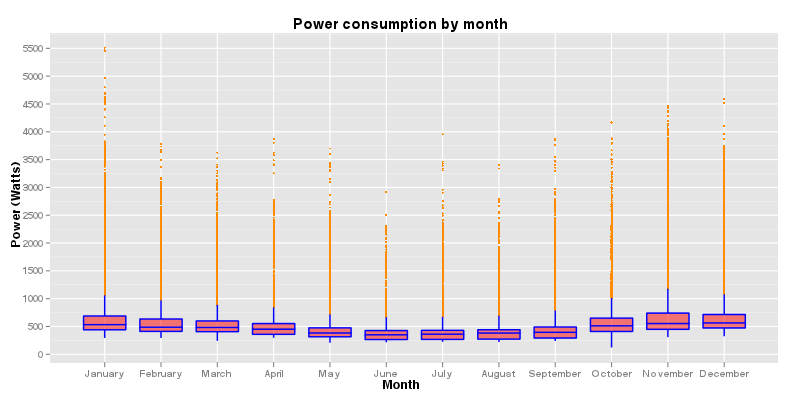
Here’s a series of boxplots showing the distribution of our power consumption, by month, for the last year:

Box and whisker plots show the distribution of a dataset without making any assumptions about the statistical distribution of the data. The box shows the range over which half the points fall (the inter-quartile distance, or IQD), and the horizontal line through the box is the median of the data. For example, in November, over half our power usage falls between about 480 and 750 Watts, with the median consumption just over 500 Watts. If that were the average, we’d use 12 KWHours / day (500 Watts * 24 hours / 1000 Watts/KWatt). The blue vertical lines extending from the boxes (the whiskers) indicate the spread of the majority of the rest of the points. The actual length of these is a somewhat arbitrary 1.5 times the IQD and provides a view of how variable the data is above and below the median. In the case of power consumption, you can tell that the distribution of the points is heavily skewed toward lower consumption values, but that there is a long tail toward higher consumption values. This makes sense when you realize that we’re almost never going to be using less than 380 Watts, but if it’s the dead of winter, our cars are plugged in and the water pump and refrigerator are on, we’ll get a very high spike in our usage. The orange points that extend beyond the whiskers are the actual data values that were outside of the box and whiskers. Again, for this data, we’ve got a lot of these “outliers” because those exceptionally high draw events happen all the time, just not for very long.

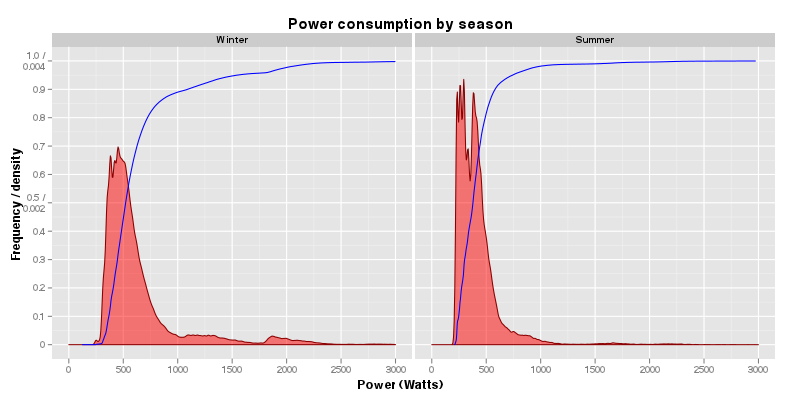
Another way to look at the data is to divide it into summer and winter, and examine the kernel density and cumulative frequency distribution of the data. In this case, the dependent variable (power consumption) is on the x-axis, and we’re looking at how often we’re using that amount of electricity. Looking at the winter density data (the red, solid curve on the left), you can see that there’s a peak just under 500 Watts where most of our usage is, but there’s also smaller peaks around 1,200 Watts and 1,800 Watts. These are probably spikes due to plugging in the vehicle heaters in the morning before we go to work (480 baseline + 640 + 650 = 1,770). The 1,200 Watt peak may be due to just having one vehicle plugged in, or due to the combination of other heaters and the lights being turned on. In summer, there’s a big spike around 350 and a secondary spike around 400. I’m not sure what that cause of that pair of peaks is, but if you look at the monthly density plots, it’s a common pattern for all the summer months. My guess is it’s the baseline sewage treatment plant, plus turning on the lights in the evening. But there aren’t really any other peaks after the distribution drops to close to zero after 1,000 Watts.
The blue line is the cumulative frequency distribution, and it can tell you what percentage of the data points occur on either side of a particular usage value. For example, if you read horizontally across the winter plot from the 0.5 (50%) mark, this intersects the blue line at just over 500 Watts. That means that half of the time, we’re using more than 500 Watts, and half the time we’re using less. The difference between summer and winter is really clear when you look at the cumulative frequency: in summer 95% of our electricity usage is below 750 Watts, but in winter 20% of our usage is above that value.
There’s still a lot more that could be done with all this data. At some point I’d like to relate our usage to other data such as the outside temperature, and I know there are statistical techniques that could help pull apart the total consumption data into it’s individual pieces. For example, as I look at the console right now it’s showing 697 Watts. I know that the sewage treatment plant, stereo, time machine, Linux server, and my laptop are all on. When the ventilation fan goes on, the signal will jump by that amount, and remain at that level until it goes off. Given enough data, these individual, incremental changes in the total consumption should reveal themselves (assuming I actually knew what the technique was, and how to perform the analysis…).
What does all this data really mean? Well, I’m not entirely sure. The idea behind these devices is that they will cause people to use less electricity because they’re getting instant feedback on how what they’re doing affects their usage. The problem is that we’ve already done almost everything what we can do to reduce our usage. Even so, it’s nice to see what’s happening, and a sudden, unexplained spike on the console can let us know when something is on that shouldn’t be.
Thus far in 2011 I’ve read three books. I finished Paul Auster’s Invisible, and read Girl Factory by Jim Krusoe on New Year’s Day. I read a few raves of the Auster book, and I’d put it in a very long list of his better books. Maybe not in the top five, but one not to miss if you like his writing. Girl Factory was excellent. After I finished it, I wrote to myself: “Highly entertaining, and the main character had a great voice. New favorite book of 2011, one day into it.” Two weeks later and I’ll stick to that opinion.
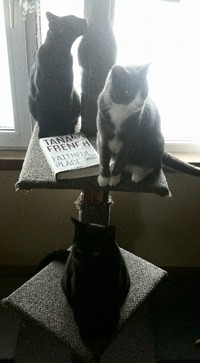
The book I just finished, while watching the Bears thrash the Seahawks, was Tana French’s Faithful Place. I can’t remember why I picked it up, but I probably should have known by the style of the dust jacket that it wouldn’t be quite my taste. It’s in the crime genre, and was a little too filled with the stock and trade of that category for me. Even so, the characters are spectacularly well fleshed out, and the sense of place was great. I don’t know anything about the lower class rowhouses of Dublin where the action takes place, but I had no trouble filling the blanks from her detailed descriptions.
Anyway, it wasn’t really my thing, but if you enjoy literate crime fiction, this is a book I can recommend.
It’s been a few years since I stopped discussing the books I’ve been reading, and I think I should get back to it again. I find it’s good to write a little (even if it’s just a sentence or two) about what I’ve read; when I don’t, I find that I don’t really think much about what I’ve read. I’m not a particularly critical reader, and I don’t expect that everything I read will need to mean something, but without consideration, many of the books I’ve read just fade into a blurry outline, and eventually disappear from memory altogether.
I’ll start by trying to recollect what I can about the books I read last year. Looking at the list on the right side of the page, it’s pretty easy to put the books into three categories: the best, the next, and the rest.
One comment before getting to the list. I like reading books on paper, rather than electronically, and I like owning the objects themselves. That some publishers (McSweeney’s, Two Dollar Radio, Tin House, for example) actually pay attention to the quality of their books means something to me, and I’m more inclined to buy a book that is typeset well, has a sewn binding, and has attractive cover art, than the crappy “Perfect” binding and shiny raised-print dust jacket that’s typical of most hardcover and paperback books these days. Maybe if companies focused on a quality product, consumers would be more likely to actually buy the thing instead of flocking to a digital version?
The best
The Instructions, Adam Levin
This one is a clear number one for me. It probably isn’t the best book I’ve ever read or anything, but there was so much to like in this book that it’s flaws are easily forgiven. The story, characters, and the way Levin slowly introduces us to the language and mind of 10-year old, possible messiah, Gurion ben-Judah Maccabe was pure pleasure. For example, he’s always talking about “chinning the air” at someone. Whenever I’d come to that phrase in the book, I’d almost involuntarily nod my head the way you greet a friend (or smile at a cat). Gurion’s friendships and the way boys fight and make friends felt real; the love story between Gurion and Eliza June Watermark was touching and painful. And brief descriptions like this:
I chugged my coffee, leaving only one sip. I liked to drink the last sip while I stepped off the train, then victory-spike it into the garbage barrel at the station = I am finished with this part of the day!
Not only is that a great image, but I like how Levin uses the equals sign to relate the actual (left side) with it’s meaning (the right side of the equation). There are a lot of conventions like this that build up through the book.
For me, the primary weakness of the book was the ending. I had a hard time understanding exactly what it was supposed to mean, not just to me, but to the characters. It wasn’t clear why this is the path they’d chosen, or what they’d hoped to accomplish. It’s not unlikely that I missed the signs earlier in the book (it’s over 1,000 pages…); and a second reading would help. But, it’s a minor complaint. It’s hard to know what Levin should have done with all the magic he’d created in the first 900 pages of the book that precede the Gurionic War.
The Thousand Autumns of Jacob de Zoet, David Mitchell
An odd story about an odd time and place: a man-made island in Nagasaki Harbor where the Dutch East India Company traded with Japan at the end of the 18th century, and the unusual mixture of modern and ancient culture. Part love story, part ninja adventure, part bureaucratic intrigue, I really enjoyed inhabiting the world of this book. Mitchell has become one of my favorite writers, and historical fiction really suits him (although it’s possible I’m saying that because I really enjoy historical fiction). I thought the last page of the book was stunning. Pure poetry.
Freedom, Jonathan Franzen
It was pretty hard to miss this book this year, and I felt like it lived up to the hype. From the very first page, the descriptions of the characters, their motivations, and the society we live in was spot on, and often hilarious. The book is the classic love triangle story between Patty, Walter and Richard, spanning their lives, hopes, dreams, and failures. I can’t recall much of a plot, but the story is the characters, and I didn’t find my mind wandering at all.
Skippy Dies, Paul Murray
Another story about a boy, but this one dies in the first few pages, and the rest of the novel recounts how and why he wound up on the floor of the doughnut shop with his friend. Like The Instructions it’s got a love story and conflict, but it deals much more with the pains of adolescence and the failed dreams of adulthood. Great book.
Half a Life, Darren Strauss
When Darren Strauss was 18 he hit and killed a classmate with his car. This book is about how that affected the rest of his life, and how he eventually came to terms with it. I thought it was amazing.
Wolf Hall, Hilary Mantel
Did I mention that I like historical fiction? Wolf Hall treads over familiar ground, King Henry the Eighth and the English reformation, but told from the perspective of Thomas Cromwell. Mantel’s Cromwell is a compelling character; an intellectual in a court of fools, a common man among Lords and Royals, and someone dedicated to his family rather than what his children can bring him. It’s also very interesting to compare the story (and man) presented here with the more common variant (see The Tudors, for example) where Thomas More is the moral hero and Cromwell is the back room dealer working only for his own financial wealth.
My only complaint is that the story isn’t finished. I can’t wait for the next volume.
The next
Norwegian Wood, Haruki Murakami
This is the book that made Murakami so popular in Japan. It’s a love story, but with the usual mystery and magic of Murakami, and is certainly the most erotic of the books of his that I’ve read. Like everything else I’ve read from him: fantastic.
Six Topics in Calamity Physics, Marisha Pessl
The buzz about this book when it came out seemed to be focused primarily on how attractive the author is. Whatever. Great book, and an incredible character in Blue. Observers wonder whether her second novel, due out in August, could possibly be as good without Blue.
Juliet, Naked, Nick Hornby
Bad Marie, Marcy Dermansky
Super Sad True Love Story, Gary Shteyngart
Stoner, John Williams
Talk Talk, T.C. Boyle
The Pesthouse, Jim Crace
Dance Dance Dance Haruki Murakami
A group of books I enjoyed, but don’t remember well enough to make specific comments on them.
The rest
I’m running out of steam here, so for these, check out the listing on the right side of the page (assuming you’re actually at my blog). The only books I can’t recommend with reservations on that list are The Orange Eats Creeps, American Psycho, and Everything is Illuminated. They just didn’t do it for me, and in the case of American Psycho, I wound up skimming much of the second half of it. Once you’ve forced yourself to listen to Bateman’s banal conversations about clothes and watch him rape and murder someone, why would you want to subject yourself to any more of that? Not to mention an entire chapter on how great Phil Collins is. Yetch. I realize this is satire, but please!

